

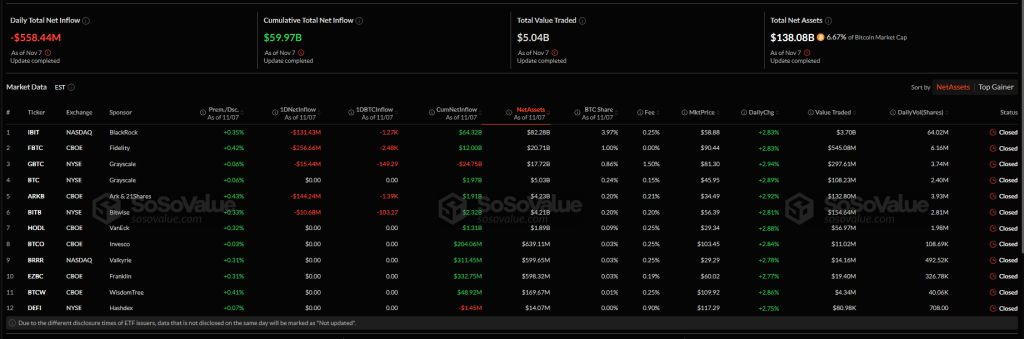
Bitcoin-focused ETFs recorded their biggest single-day outflows since August, taking a combined $558 million out of the market as prices hovered around $102,000. Facts from SoSoValue shows that this move has pushed some major funds into the red and provided new signals that traders are rebalancing after recent gains.
Fidelity and Ark lead outflows
Fidelity’s FBTC saw the largest drawdown at $256 million. Ark Invest and ARKB of 21Shares followed with $144 million in redemptions, a record relative to the size of that fund. BlackRocks IBIT also recorded an outflow of $131 million, marking the seventh day of net withdrawals in eight trading sessions.
At the same time, reports indicate that JPMorgan increased its stake in BlackRock’s ETF by 64%, bringing its holdings to 5.28 million shares worth $343 million as of September 30. The bank also held $68 million in call options and $133 million in put positions on the same date.
Market participants are cutting positions, while some are adding new positions
Based on reports, the large daily outflow looks less like a crash and more like a position shift. Some managers appear to be taking profits. Others are quietly adding exposure, which helps explain why prices have remained more or less stable despite the redemptions. Traders are watching ETF flows say the moves reflect growing macro uncertainty rather than a complete loss of confidence in Bitcoin.
Whale sales and long-term cash-out holders
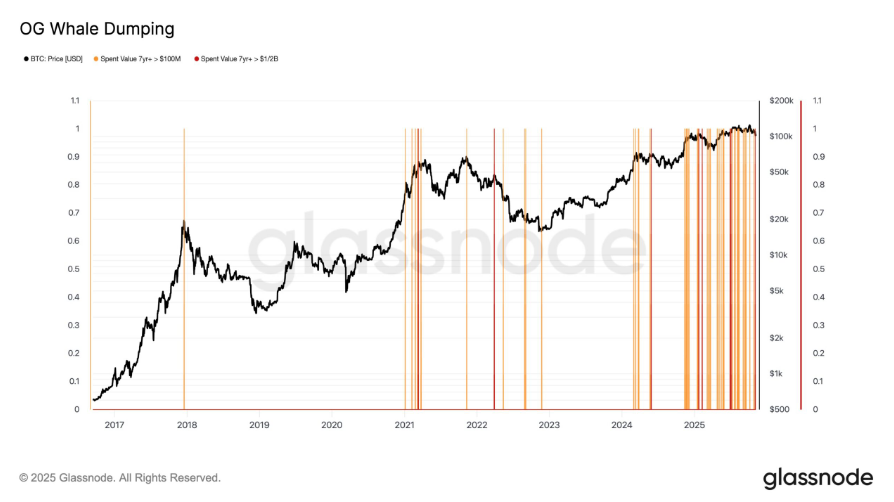
On-chain trackers show that wallets that have been inactive for a long time are moving large amounts of money. Sales in the $100 million to $500 million range have been recorded from addresses that have been dormant for years.
K33 Research noted that 319,000 BTC, which had been held for six to twelve months, ended up in profit taking. The company also reported that “mega whales” sold approximately $45 billion worth of Bitcoin in the past month. Analysts describe this as a large, orchestrated exit by early holders.
Price remains within the key range as the moving averages rise
Bitcoin traded in a tight band. Reports place a demand block between $100,000 and $102,000 and a resistance cluster around $114,000. The 100 and 200 day moving averages are above current prices and acted as overhead resistance.
A recent rejection around the 100-day MA near $110,000 led to a quick retest of support at roughly $101,000, which some traders are interpreting as a liquidity clearing.
Price stabilization may indicate absorption
What will stand out for chart watchers is the stabilization at a high-volume intersection, where past corrections have found a basis. There is an extended series of equal lows, marked as support levels on some charts, indicating that liquidity below $100,000 may have disappeared.
Featured image from Unsplash, chart from TradingView