Amid the increasing bullishness in the crypto market, the price trends of Bitcoin, Ethereum, and XRP are on an explosive path. Bitcoin is closing in on $100,000, XRP is 52 weeks old and Ethereum is presenting a new breakout run.
With the broader market expecting a new peak in December 2024, the first week could be filled with massive inflows. So let’s take a look at the upcoming price trends of the top cryptos and determine the chances of the next bull run.
Bitcoin is targeting $100,000
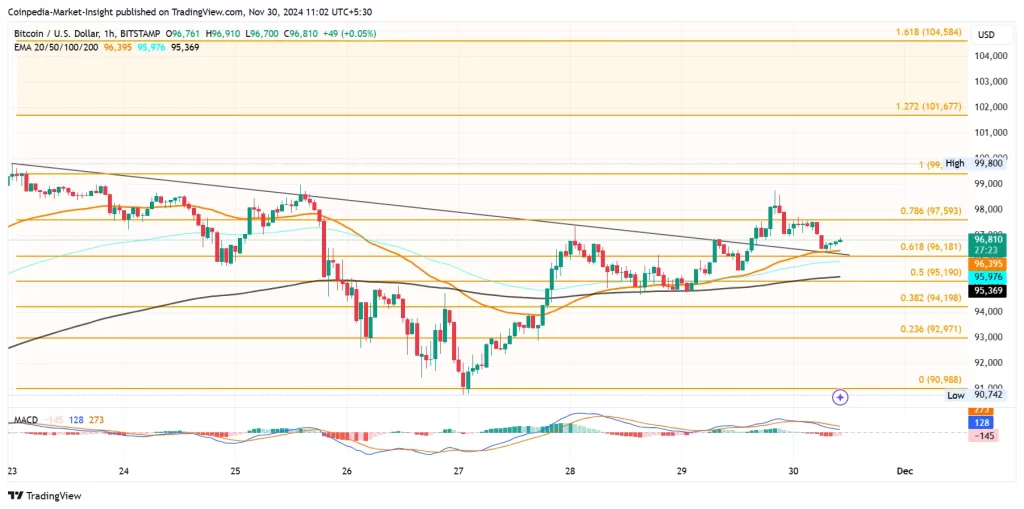
On the 1-hour chart, the BTC price trend shows a recovered rally, delivering a break in the trendline. After overcoming a prolonged bearish influence, BTC price has crossed the USD 97,600 mark and is almost reaching the USD 99,000 mark.

However, the higher price rejection led to a quick retest of the broken trendline. Currently, Bitcoin is trading at $96,395. BTC found support at the 50-EMA of the 1-hour chart and is now making a positive test reversal.
The bullish recovery has led to a gold crossover and a positive alignment of the 50, 100 and 200 EMA on the 1-hour chart. With the post-retest reversal gaining momentum with four consecutive bullish candles, the MACD and signal lines are about to give a positive crossover.
Based on the Fibonacci levels, a post-retest reversal that maintains dominance above the 78.6% Fibonacci level could cross the $100,000 mark in the first week of December.
Moreover, the price trend could reach the peak of $104,584 next weekend. On the other hand, consolidation around the USD 96,000 mark could result in a bearish outcome and reach the USD 95,000 support level.
Will the price of Ethereum (ETH) exceed $4,000?
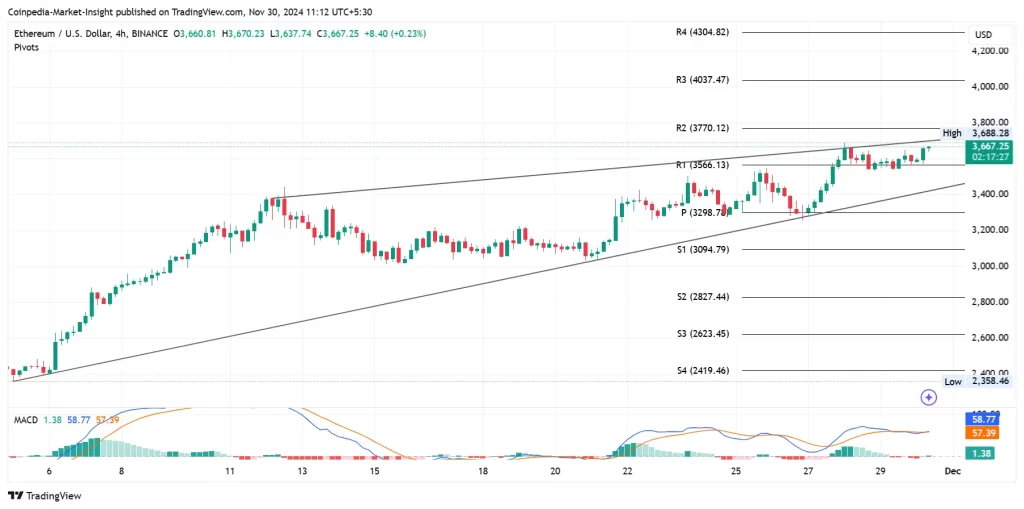
Ethereum’s price trend shows a rising wedge pattern on the 4-hour chart. With the higher high and higher low trend facing a massive supply of a local resistance trendline, the Ethereum price trend is approaching a bottleneck.

Currently, it is analyzing the overhead trendline and trading at $3,667. To support the uptrends, despite the consolidation margin, the MACD and signal lines merge and can come back into positive alignment.
A bullish breakout will set the $4,037 and $4,300 mark as potential price targets next week. On the downside, the crucial support remains at $3,298.
Want to stack some Ether? Get the potential price targets in our Ethereum price forecast
XRP aims for $2
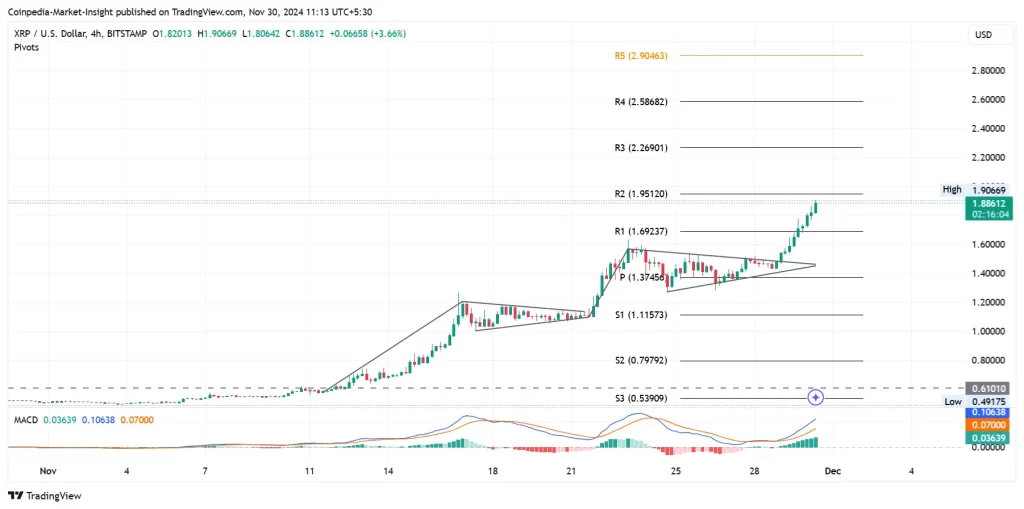
The XRP price trend shows a second bullish flag pattern breakout rally. With a series of bullish candles delivering a parabolic recovery, the XRP price is moving closer to the $2 mark.

It is currently trading at $1.886, with a 24-hour high of $1.90. The MACD and signal lines have delivered a positive crossover with a huge wave of gradually increasing bullish histograms.
Based on the pivot levels, the immediate price resistance is $1.95. However, based on the trend momentum and the bullish rally in the bull market, the XRP price could reach $2,586 by the end of next week. The minimum support for the coming week is estimated at $1.69 or $1.37.
Frequently asked questions
BTC is on the verge of breaking $100,000, with a potential target of $104,584 based on Fibonacci levels.
ETH forms a rising wedge, with upside targets of $4,037 and $4,300 if it breaks overhead resistance.
XRP could rise to $2,586, supported by a bullish flag breakout and strong momentum indicators.

