- The sentiment in the crypto world is bearish and fearful, but the masses are not always right
- Short-term indicators remain bearish, but a rebound in accumulation is encouraging
Bitcoin [BTC] was trading for $94.5k at the time of writing. On Tuesday, January 7, it was rejected at or above the $100,000 zone for the third time in a month. Therefore, market participants were scared and speculating whether this dip would send BTC into a full-fledged downtrend and usher in the next bear market.

Source: Santiment Insights
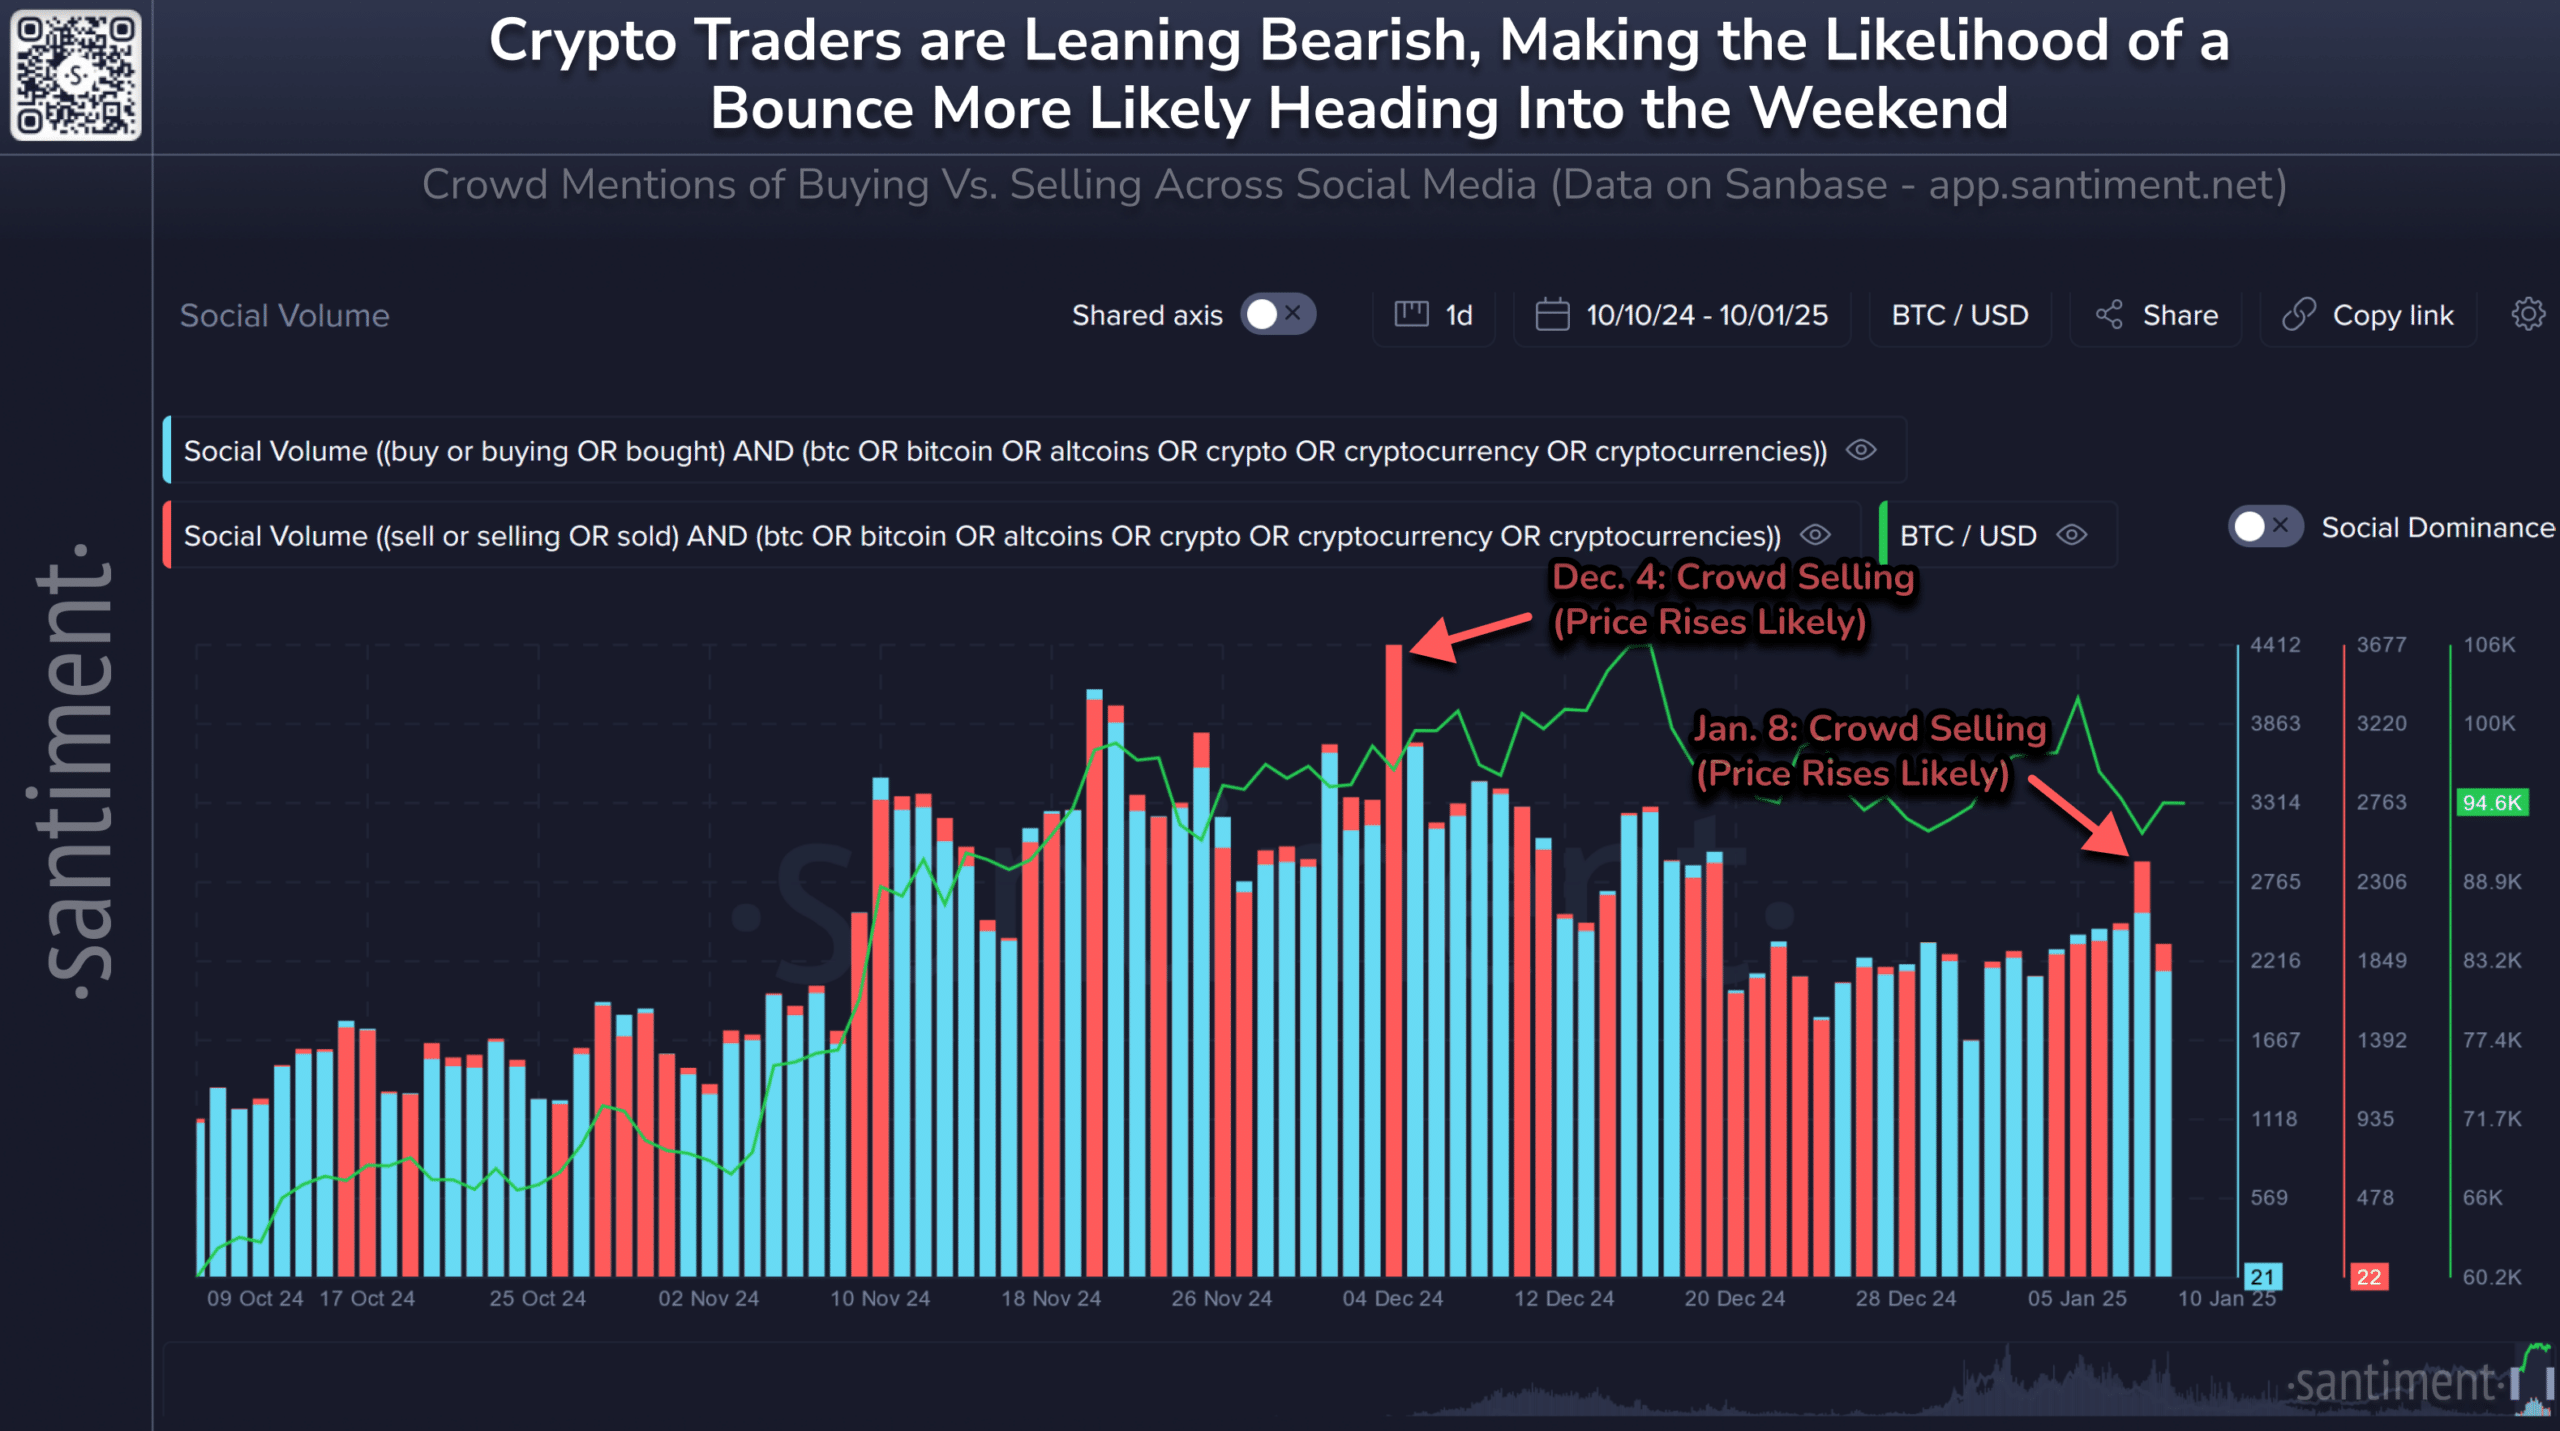
The measure of social volume from a Santiment Insights post revealed that crowd selling social volume was noticeably stronger on January 8. The last time this happened was on December 4th. At the time, the price rebounded higher, eventually reaching an all-time high of $108.3k.
The 8% drop since Tuesday means there is fear in the market. A liquidity hit below $92,000 could lead to a recovery, as could a “Trump pump” after the inauguration. The dollar index [DXY] has moved higher over the past month, which helps explain the bulls’ woes.
Bitcoin Traders – Buy the Fear, Sell the Greed
The common saying, which is repeated so often that listeners sometimes roll their eyes before the sentence is completed, is sometimes true. Context is also important and the on-chain metrics for Bitcoin do not yet indicate that a market top is on the horizon.
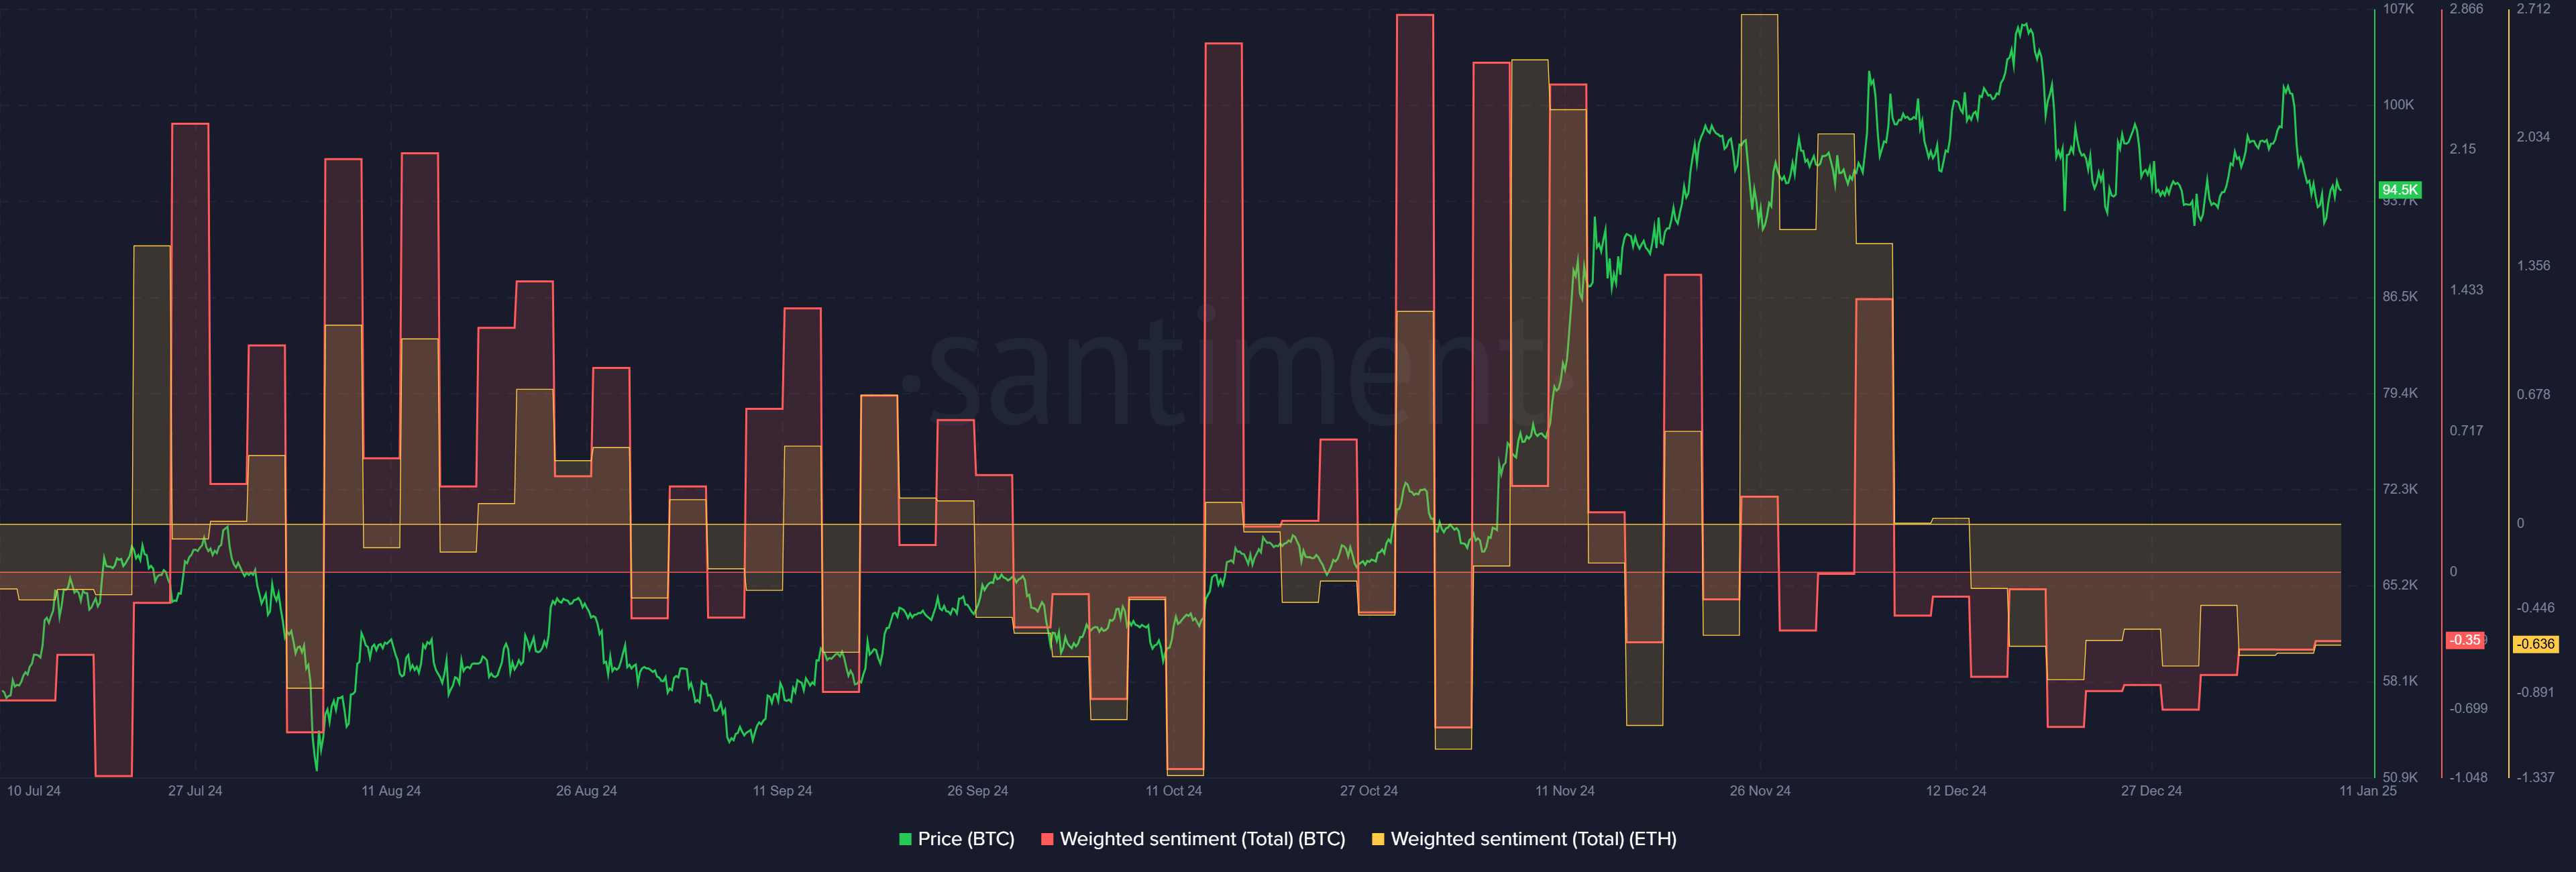
The weighted sentiment for BTC and ETH was compared side by side. The comparison showed that both traders and investors had a bearish view of the market since the price drop on December 19. Neither asset has recovered on the price front yet.
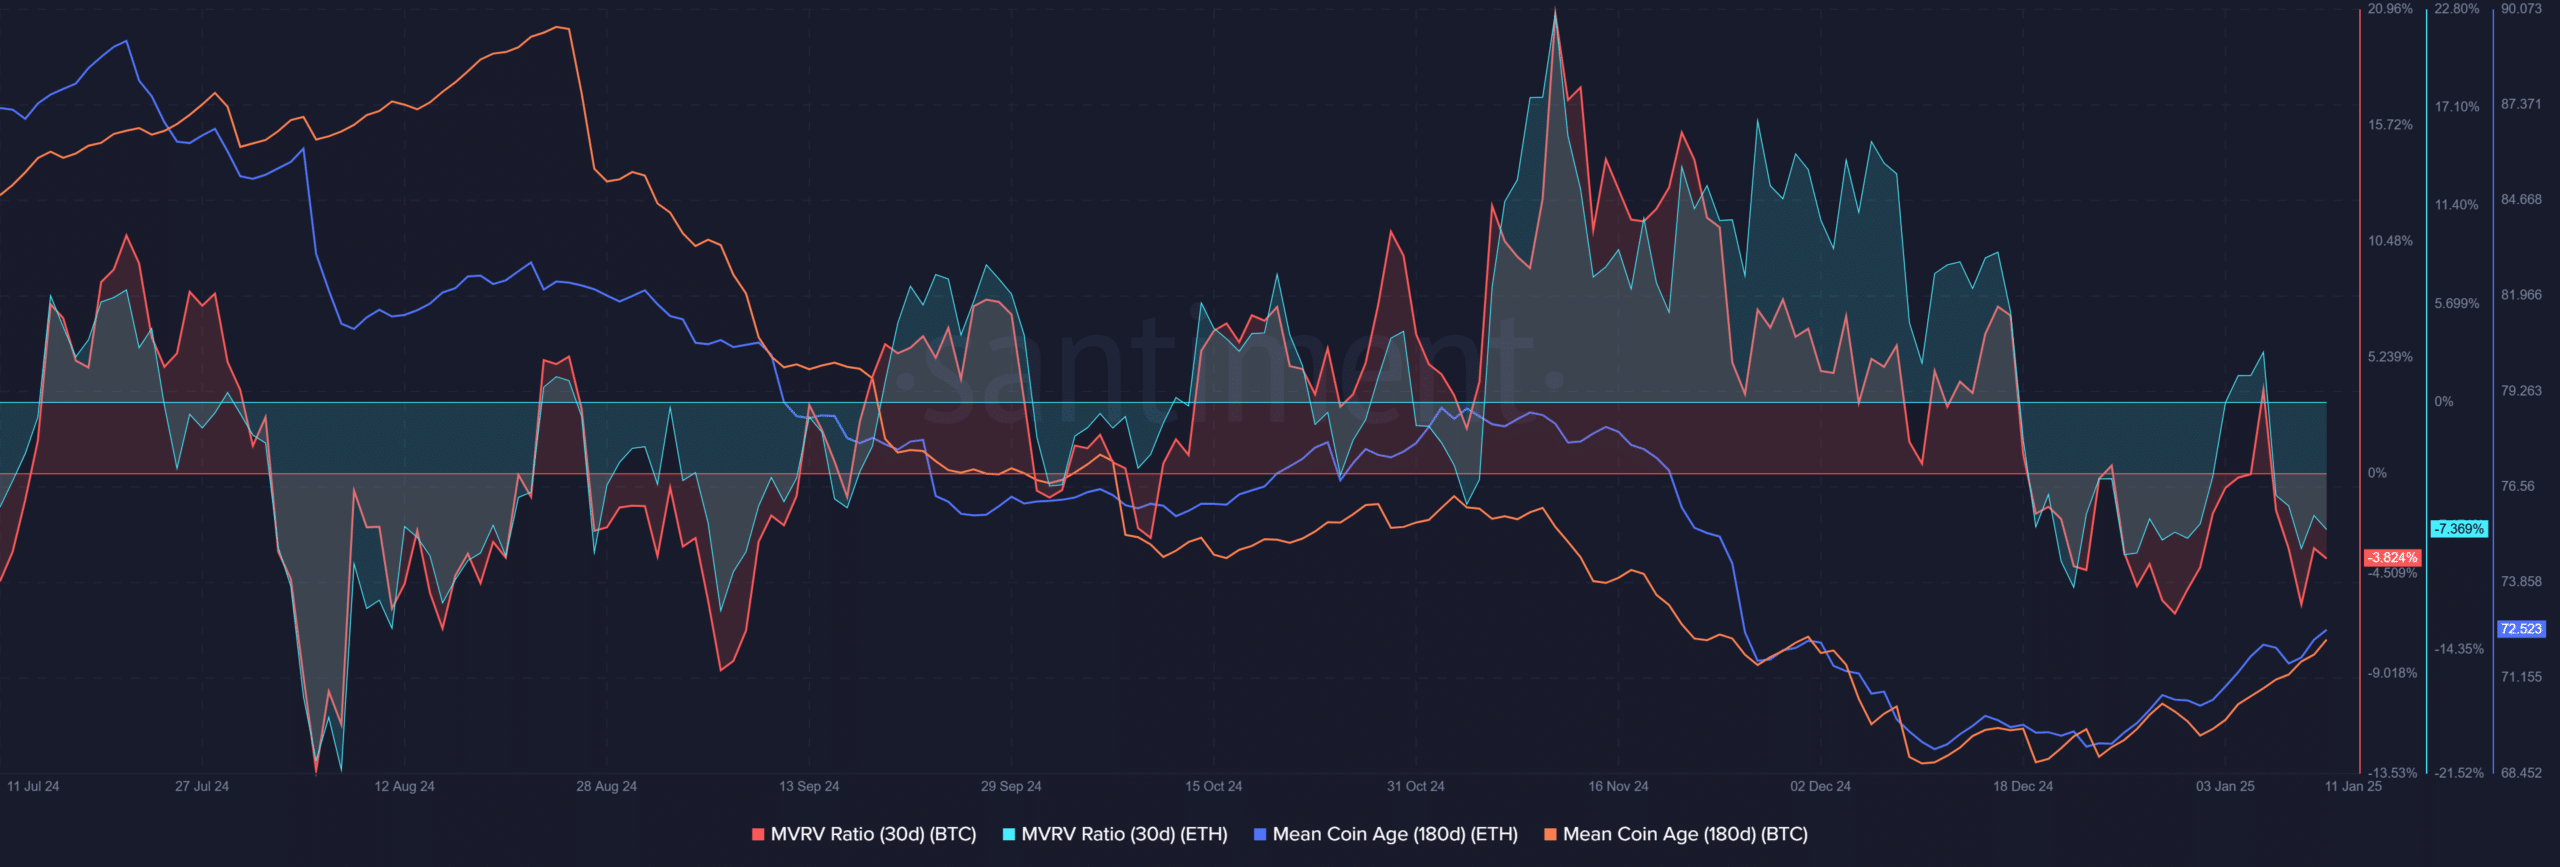
The 30-day MVRV ratios for both leading crypto assets were also negative. This suggested that short-term holders (STHs) of BTC and ETH were at a loss. Interestingly, the average coin age of 180 days for both assets has started to trend upward over the past three weeks.
This was a signal to buy the dip. Increased accumulation and STHs at a loss hinted at lower looming selling pressure and increased chances of recovery.
Open Interest showed an upward trend from early November to mid-December. However, since then there has been a slight decline. OI has fallen from $13.7 billion on December 16 to $11.72 billion at the time of writing.
Is your portfolio green? Check the Bitcoin Profit Calculator
This drop in OI is another sign that speculative interest has waned, underscoring bearish near-term expectations. By the time these short-term indicators turn around and show positive signals, Bitcoin’s price may have already started to recover.
Traders must weigh risk versus opportunity and decide whether to enter above the $92k support.


