

Bitcoin price failed to recover above $96,500. BTC is down more than 3% and there are chances of more downside below $92,000.
- Bitcoin started a new decline below $95,000 and $94,500.
- The price is trading below $98,000 and the 100 hourly Simple Moving Average.
- A bearish trendline is forming with resistance at $96,600 on the hourly chart of the BTC/USD pair (data feed from Kraken).
- The pair could continue to decline if it moves below the $92,500 zone.
Bitcoin price continues to fall
Bitcoin price failed to remain in a positive zone above the USD 95,500 pivot level. BTC bears remained active below $95,500 and pushed the price down.
The bears gained strength and were able to push the price below the $94,000 zone. A low was formed at $92,890 and the price is now consolidating losses near the 23.6% Fib retracement level from the recent decline from the swing high of $103,998 to the low of $92,890.
Bitcoin is now trading below $95,000 and the 100 hourly Simple Moving Average. Moreover, a bearish trendline is forming with resistance at $96,600 on the hourly chart of the BTC/USD pair.
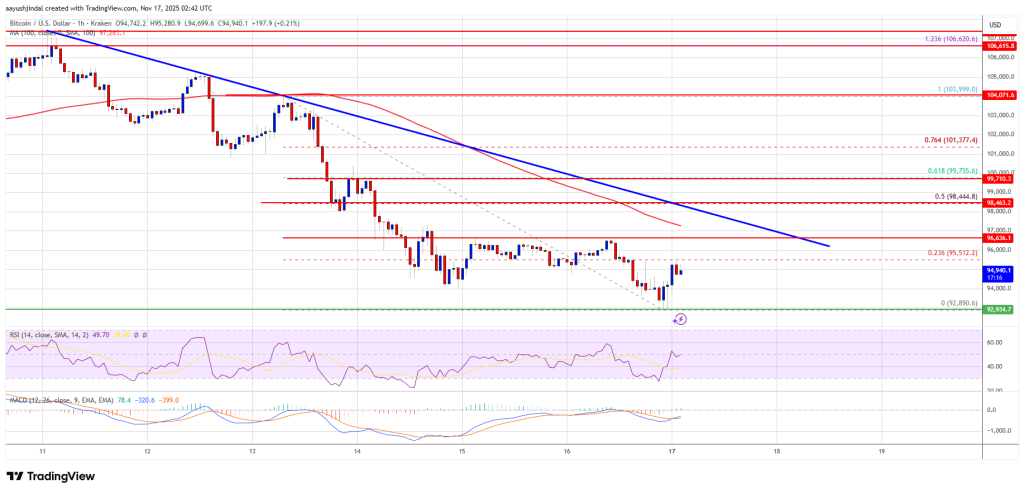
If the bulls attempt another recovery wave, the price may encounter resistance near the USD 95,500 level. The first major resistance is near the $96,500 level and trendline. The next resistance could be $97,200. A close above the USD 97,200 resistance could send the price rising further. In the mentioned case, the price could rise and test the USD 98,500 resistance. Any further gains could send the price towards the USD 99,500 level. The next barrier for the bulls could be $100,000 and $100,500.
Lose more in BTC?
If Bitcoin fails to rise above the USD 96,600 resistance zone, it could trigger another decline. Immediate support is near the $93,500 level. The first major support is near the $92,500 level.
The next support is now near the $91,500 zone. Any further losses could send the price towards the $90,000 support in the short term. The key support is at $88,500, below which BTC could potentially accelerate lower in the near term.
Technical indicators:
Hourly MACD – The MACD is now gaining speed in the bearish zone.
Hourly RSI (Relative Strength Index) – The RSI for BTC/USD is now below the 50 level.
Major support levels – USD 92,500, followed by USD 90,000.
Major resistance levels – $95,500 and $96,600.