

On-chain data shows that Bitcoin exchange inflows from the short-term holders have intensified recently as the asset’s rally has stalled.
Bitcoin Short-Term Holders Show Increased Inflows
This is evident from data from the on-chain analytics company Glasnode, short-term holders have recently realized inflows equal to 1.28% of their total supply. The “exchange inflow” here refers to an indicator that measures the total amount of Bitcoin that investors are currently depositing on centralized exchanges.
Generally, investors are depositing on these platforms for sales-related purposes, so when the value of this metric is high, it is a possible sign of dumping in the market. Of course, this kind of trend could have bearish consequences for the price of the cryptocurrency.
The exchange inflow is usually defined for the entire market, but in the context of the current discussion, the focus is only on the inflow made by the “short-term holders” (STHs).
The STHs are one of the two main cohorts in the Bitcoin market (the others being the “long-term holders”), and they include all investors who have owned their coins for less than 155 days.
As their name implies, these investors don’t hold on too long as they tend to be the most fickle bunch in the market and sell easily at the sight of FUD or profit taking opportunities.
Now, below is a chart showing the trend in Bitcoin exchange inflows specifically for the STHs over the past year or so.
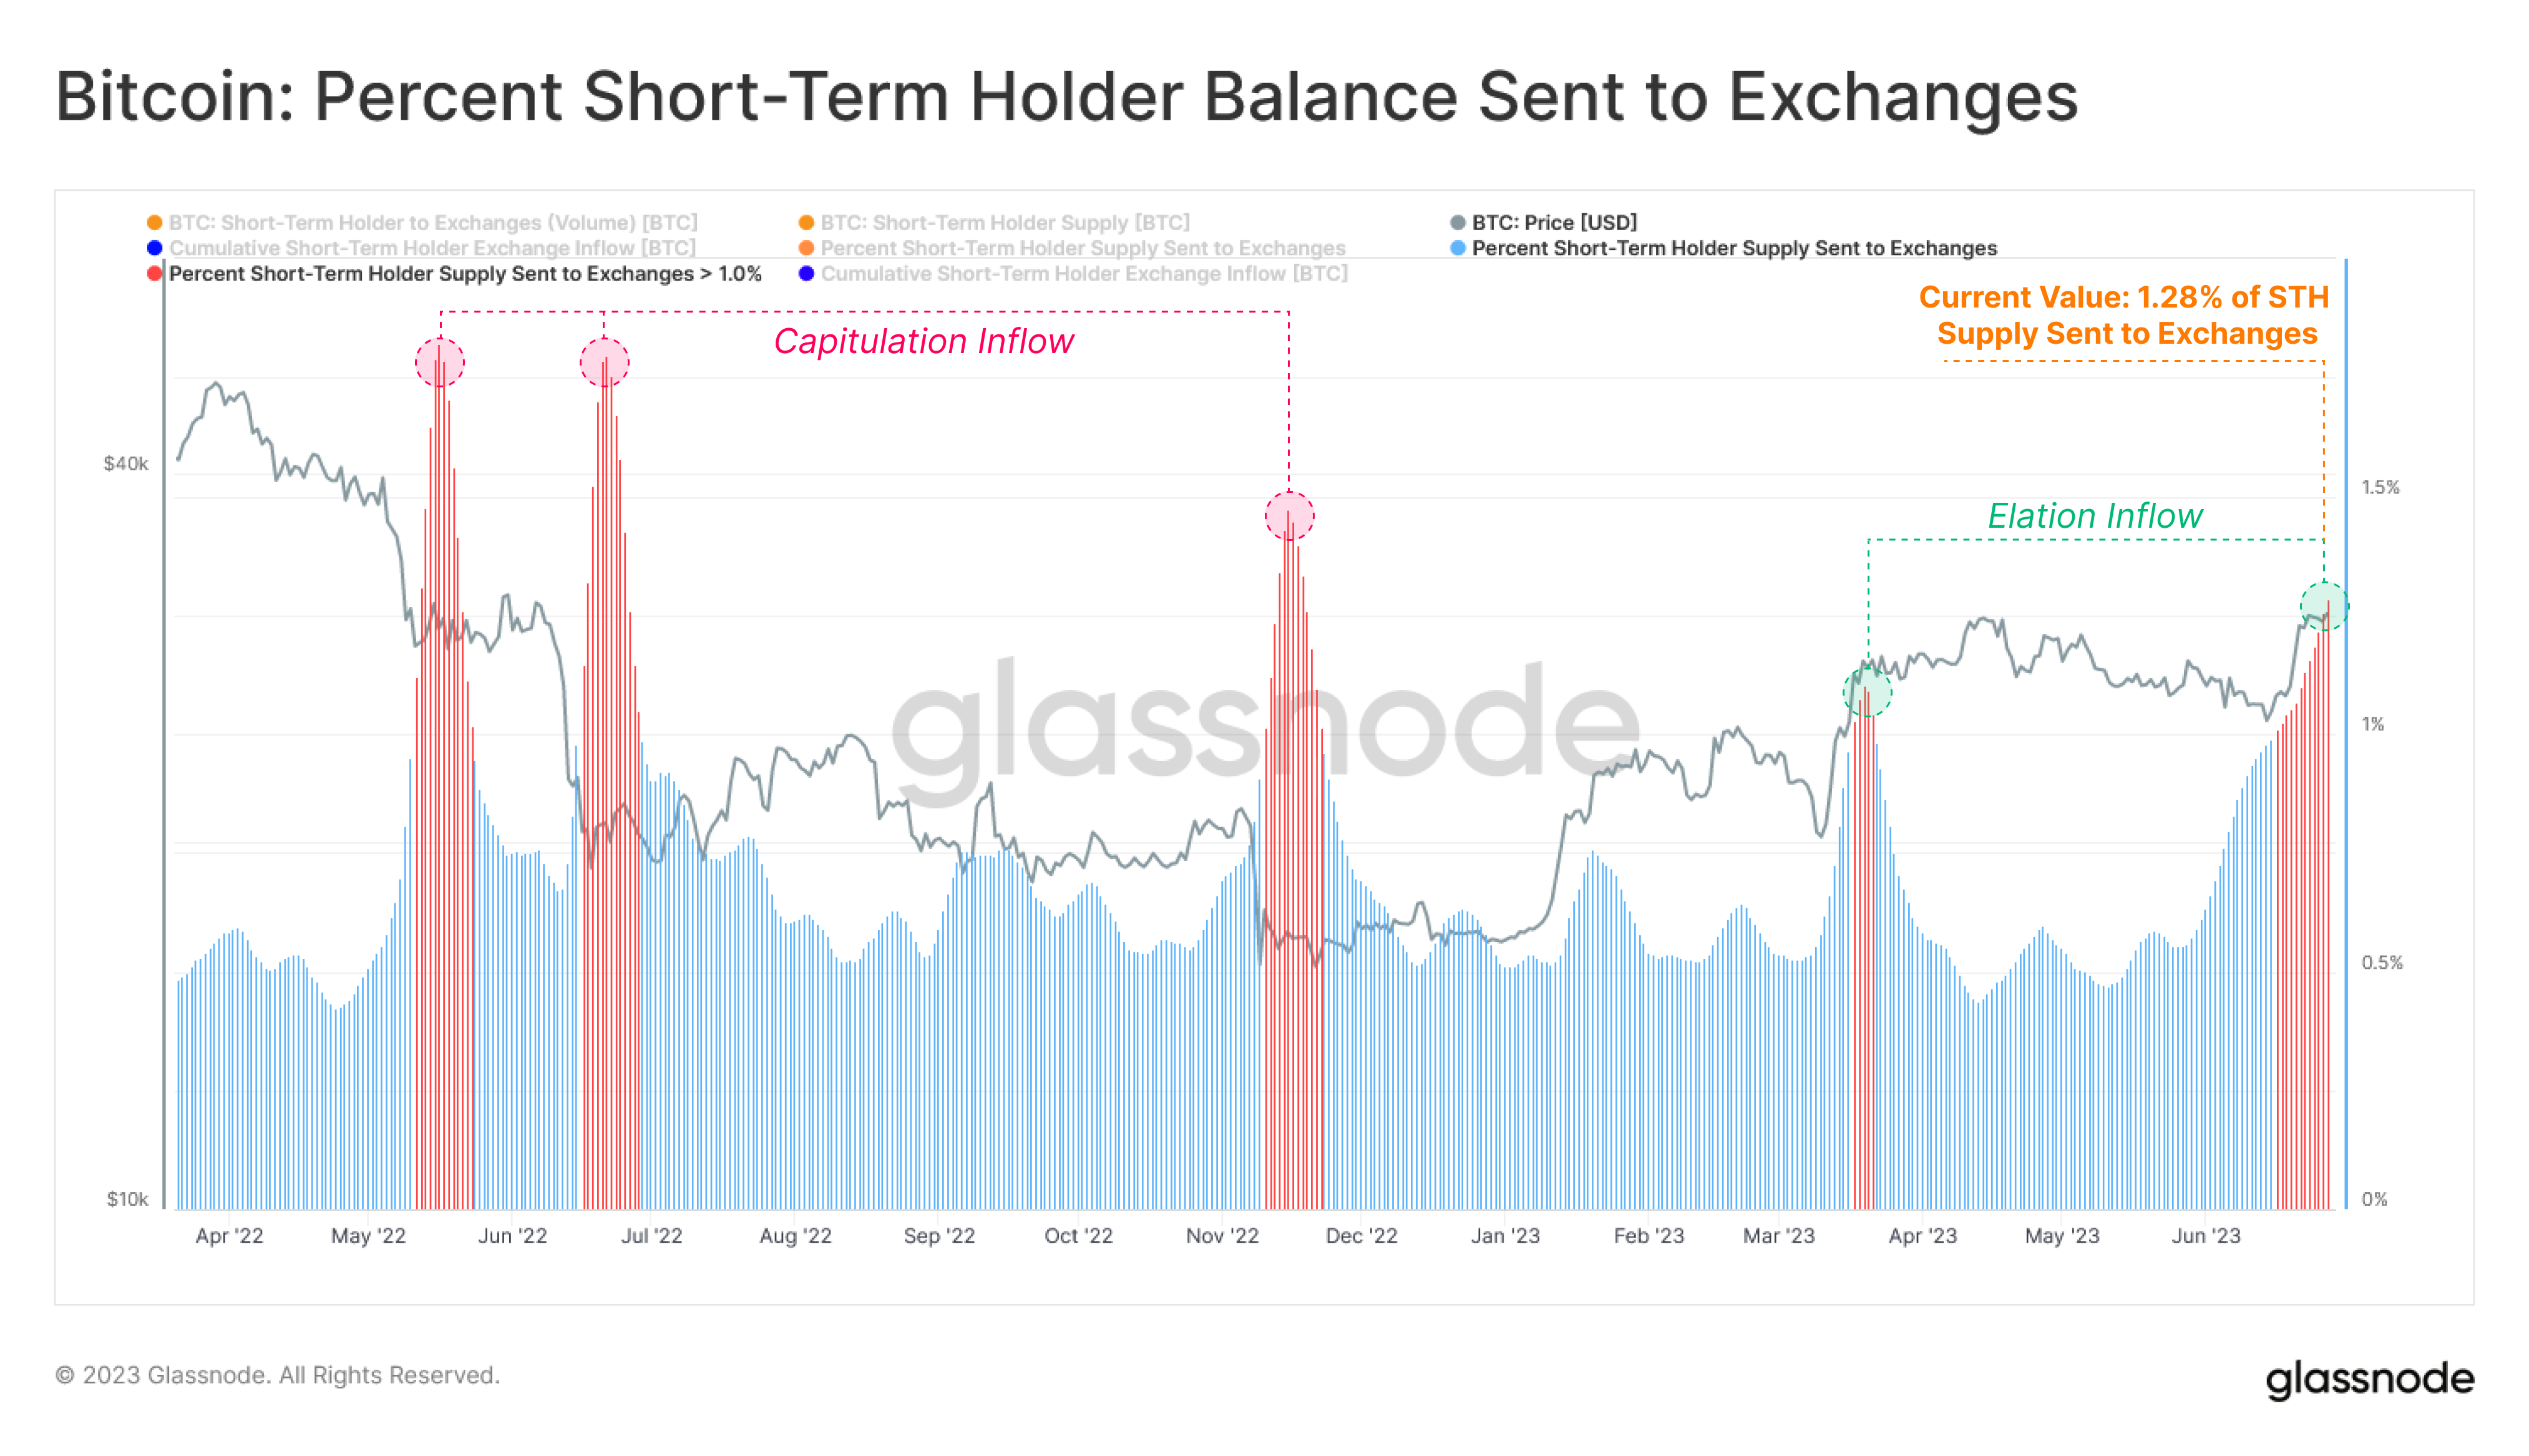
The value of the metric seems to have been quite high in recent days | Source: Glassnode on Twitter
Shown here are the exchange inflows of the STHs as a percentage of their supply (that is, the sum of the wallet amounts each individual STH is currently holding). The chart shows that the value of the indicator had risen to notable levels earlier in the month as the market went through FUD, such as the SEC lawsuits against cryptocurrency exchanges Binance and Coinbase.
While the STHs were clearly panicking at the time, the volume of their sales was still significantly lower than the other sales that have taken place over the past year.
However, after the latest rally in the price of the cryptocurrency above the USD 30,000 level, the value of the indicator has shown a sharp increase. Now the statistic has reached a value of 1.28%, meaning that the STHs have recently made an inflow equivalent to 1.28% of their supply.
This level is higher than during the rebound rally in March this year. As can be seen in the chart, the rally had hit the brakes by then as STHs ramped up their sales.
So far, Bitcoin has followed a sideways trend since the recent sharp price increase. So it is possible that the current intensified sales of the STHs are behind this trend, similar to how it was in March.
BTC price
At the time of writing, Bitcoin is trading around $30,100, up 4% over the past week.
BTC continues to hold above the $30,000 mark | Source: BTCUSD on TradingView
Featured image by Maxim Hopman on Unsplash.com, charts from TradingView.com, Glassnode.com