

Bitcoin price is up over 15% and is trading near the USD 35,000 resistance. BTC could correct in the short term before starting to rise again.
- Bitcoin started a surge after speculation that spot ETF would be listed on the DTCC.
- The price is trading above USD 34,000 and the 100 hourly Simple Moving Average.
- A connecting bullish trendline is forming with support near $32,500 on the hourly chart of the BTC/USD pair (data feed from Kraken).
- The pair could correct in the short term before resuming its rise.
Bitcoin Price Rises Over 15%
Bitcoin price started to rise sharply after speculation that spot ETF would be listed on DTCC. BTC gained bullish momentum after breaking the USD 32,000 resistance zone.
There was a significant increase towards the $35,000 resistance zone. A new multi-week high is being formed near USD 35,225 and the price is now consolidating gains. It is trading well above the 23.6% Fib retracement level of the upward move from the $30,400 swing low to the $35,225 high.
Bitcoin is now trading above $34,000 and the 100 hourly Simple Moving Average. A connecting bullish trendline is also forming with support near $32,500 on the hourly chart of the BTC/USD pair. The trendline is near the 61.8% Fib retracement level of the upward move from the $30,400 swing low to the $35,225 high.
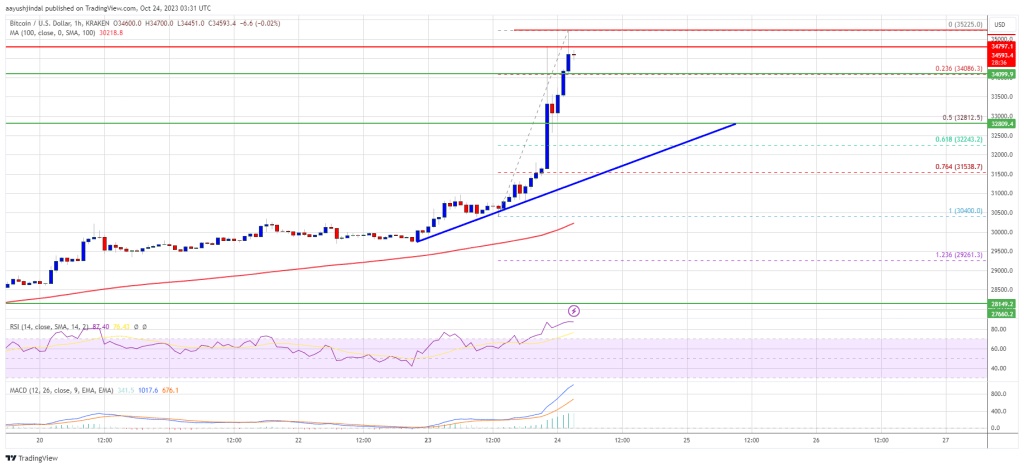
Source: BTCUSD on TradingView.com
On the upside, immediate resistance is around the $34,800 level. The next major resistance could be near USD 35,250. A clear move above the recent high could send the price towards the USD 36,200 resistance. The next major resistance could be at USD 37,000. Any further gains could send BTC towards the $38,000 level in the coming days.
Cons supported in BTC?
If Bitcoin fails to rise above the USD 34,800 resistance zone, a downward correction could occur. The immediate downside support is near the $34,120 level.
The next major support is near the $32,800 level and trendline. If there is a move below the trendline support, the price might drop towards the $31,500 level in the coming sessions.
Technical indicators:
Hourly MACD – The MACD is now gaining speed in the bullish zone.
Hourly RSI (Relative Strength Index) – The RSI for BTC/USD is now above the 50 level.
Major support levels – USD 34,120, followed by USD 32,800.
Major resistance levels – $34,800, $35,000 and $35,250.