

Bitcoin price started a recovery wave above the $62,500 zone. BTC is consolidating and could target more gains if it breaks the USD 64,000 resistance zone.
- Bitcoin started a recovery wave and climbed above $62,000.
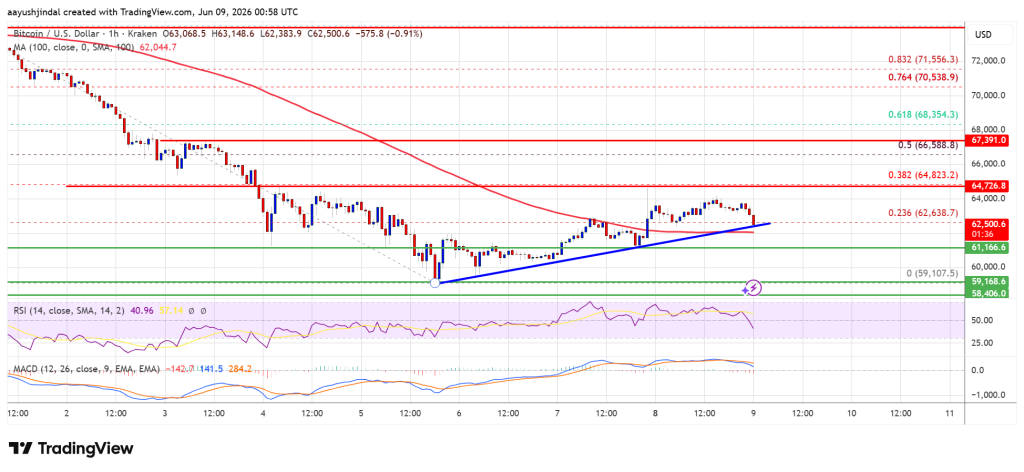
- The price is trading above USD 62,200 and the 100 hourly simple moving average.
- A bullish trendline is forming with support at $62,500 on the hourly chart of the BTC/USD pair (data feed from Kraken).
- The pair could gain bullish momentum if it settles above the $64,000 zone.
Bitcoin Price Recovery Faces Resistance
Bitcoin price remained supported above the $60,500 zone. BTC formed a base and settled above $61,500 to start a recovery wave. There was a move above the USD 62,200 and USD 62,500 levels.
The price even surpassed the 23.6% Fib retracement level of the downward move from the $74,100 swing high to the $59,106 low. However, the bears appear to be active around $64,000. The price drops again below the USD 63,200 level.
Bitcoin is now trading above $62,500 and the 100 hourly moving average. Moreover, a bullish trendline is forming with support at $62,500 on the hourly chart of the BTC/USD pair.
If the price remains stable above $62,500, another move up could be attempted. The immediate resistance is near the $63,500 level. The first major resistance is around the $64,000 level. A close above the USD 64,000 resistance could send the price higher. In the mentioned case, the price could rise and test the USD 65,500 resistance. Any further gains could send the price towards the $66,500 level or towards the 50% Fib retracement level of the downward move from the $74,100 swing high to the $59,106 low. The next barrier for the bulls could be $68,000.
Disadvantage of continuation in BTC?
If Bitcoin fails to rise above the $64,000 resistance zone, it could trigger another decline. Immediate support is near the $62,500 level.
The first major support is near the $62,200 level. The next support is now near the $61,500 zone. Any further losses could send the price towards the USD 61,000 support in the near term. The key support is now at $60,000, below which BTC could struggle to recover in the near term.
Technical indicators:
Hourly MACD – The MACD is now losing pace in the bullish zone.
Hourly RSI (Relative Strength Index) – The RSI for BTC/USD is now below the 50 level.
Major support levels – USD 62,500, followed by USD 62,000.
Major resistance levels – $64,000 and $65,500.