

Bitcoin price is trying to recover above $108,500 and $108,800. BTC could rise further if there is a clear move above the USD 111,200 resistance.
- Bitcoin started a new recovery wave above the $108,800 resistance level.
- The price is trading above $109,000 and the 100 hourly Simple Moving Average.
- There was a break above a short-term channel with resistance at $108,700 on the hourly chart of the BTC/USD pair (data feed from Kraken).
- The pair could continue to rise if it trades above the $111,200 zone.
Bitcoin price starts to rise again
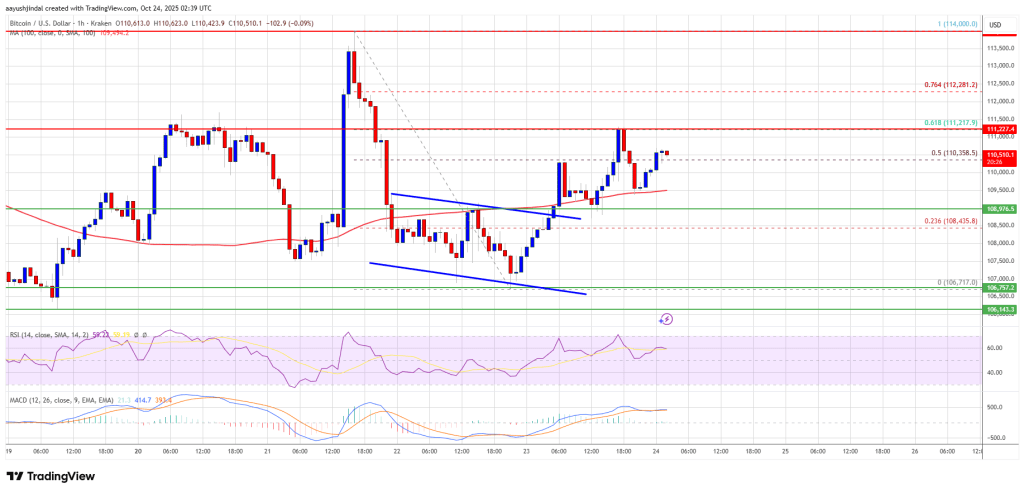
Bitcoin price fell below the $109,000 level again. BTC tested the $106,720 zone and is currently attempting another increase. There was a move above the USD 108,000 and USD 108,800 resistance levels.
The price climbed above the 50% Fib retracement level of the downward move from the $114,000 swing high to the $106,717 low. Additionally, there was a break above a short-term channel with resistance at $108,700 on the hourly chart of the BTC/USD pair.
Bitcoin is now trading above $109,000 and the 100 hourly Simple Moving Average. Immediate resistance on the upside is near the $111,200 level or the 61.8% Fib retracement level of the downward move from the $114,000 swing high to the $106,717 low.
The first major resistance is around the $111,500 level. The next resistance could be $112,500. A close above the resistance at $112,500 could send the price higher. In the mentioned case, the price could rise and test the USD 113,200 resistance. Any further gains could send the price towards the $114,000 level. The next threshold for the bulls could be $115,500.
Another drop in BTC?
If Bitcoin fails to rise above the USD 111,200 resistance zone, it could start a new decline. Immediate support is near the $109,500 level. The first major support is near the $108,800 level.
The next support is now near the $108,500 zone. Any further losses could send the price towards the $107,400 support in the near term. The key support is at $106,500, below which BTC could struggle to recover in the near term.
Technical indicators:
Hourly MACD – The MACD is now gaining speed in the bullish zone.
Hourly RSI (Relative Strength Index) – The RSI for BTC/USD is now above the 50 level.
Major support levels – $109,500, followed by $108,800.
Major resistance levels – $111,200 and $112,500.