

Bitcoin price started a consolidation phase below $90,500. BTC is consolidating losses and could attempt a recovery wave if it clears $91,500.
- Bitcoin started a small recovery wave from the $87,200 level.
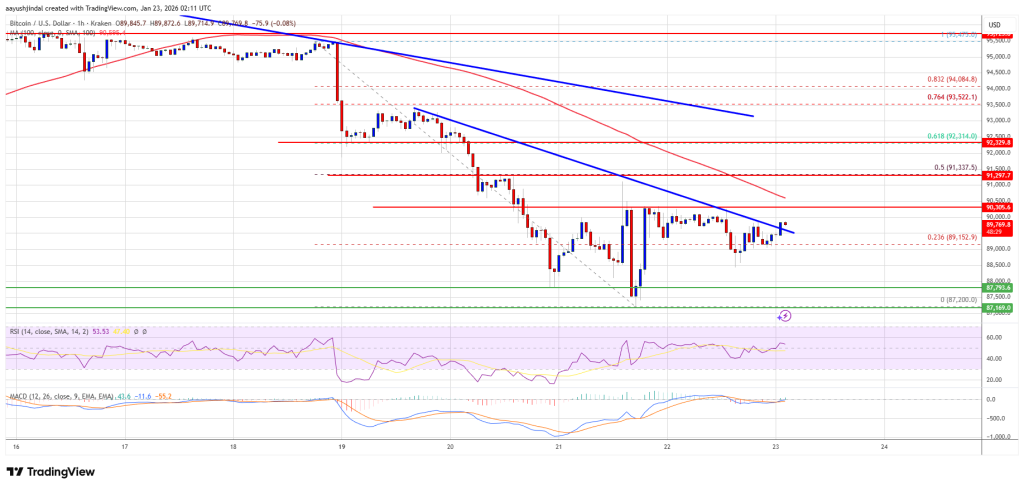
- The price is trading below $90,500 and the 100 hourly Simple Moving Average.
- There was a break above a short-term bearish trendline with resistance at $89,700 on the hourly chart of the BTC/USD pair (data feed from Kraken).
- The pair could recover if it manages to settle above $90,500 and $91,500.
Bitcoin Price Eyes recovery
Bitcoin price failed to stay above the $90,000 support and led to prolonged losses. BTC fell sharply below the USD 89,500 and USD 88,000 support levels.
The bears even pushed the price below $87,500. A low was formed at $87,200, and the price is now trying to make a recovery wave. There was a move above the 23.6% Fib retracement level of the downward move from the $95,475 swing high to the $87,200 low.
Additionally, there was a break above a short-term bearish trendline with resistance at $89,700 on the hourly chart of the BTC/USD pair. Bitcoin is now trading below $90,500 and the 100 hourly Simple Moving Average.
If the price remains stable above $89,000, another move up can be attempted. The immediate resistance is near the $90,300 level. The first major resistance is near the $91,500 level as it is close to the 50% Fib retracement level of the downward move from the $95,475 swing high to the $87,200 low.
A close above the USD 91,500 resistance could send the price rising further. In the mentioned case, the price could rise and test the USD 92,300 resistance. Any further gains could send the price towards the $93,000 level. The next barrier for the bulls could be $95,000 and $95,500.
Another drop in BTC?
If Bitcoin fails to rise above the USD 91,500 resistance zone, it could trigger another decline. Immediate support is near the $89,000 level. The first major support is near the $88,200 level.
The next support is now near the $87,500 zone. Any further losses could send the price towards the USD 86,500 support in the short term. The key support is at $85,500, below which BTC could potentially accelerate lower in the near term.
Technical indicators:
Hourly MACD – The MACD is now losing pace in the bearish zone.
Hourly RSI (Relative Strength Index) – The RSI for BTC/USD is now above the 50 level.
Major support levels – USD 89,000, followed by USD 88,200.
Major resistance levels – $90,300 and $91,500.