

Bitcoin price started a big rise above $91,200. BTC is now showing bullish signs and could extend gains above $93,000.
- Bitcoin started a new rise above the $91,200 zone.
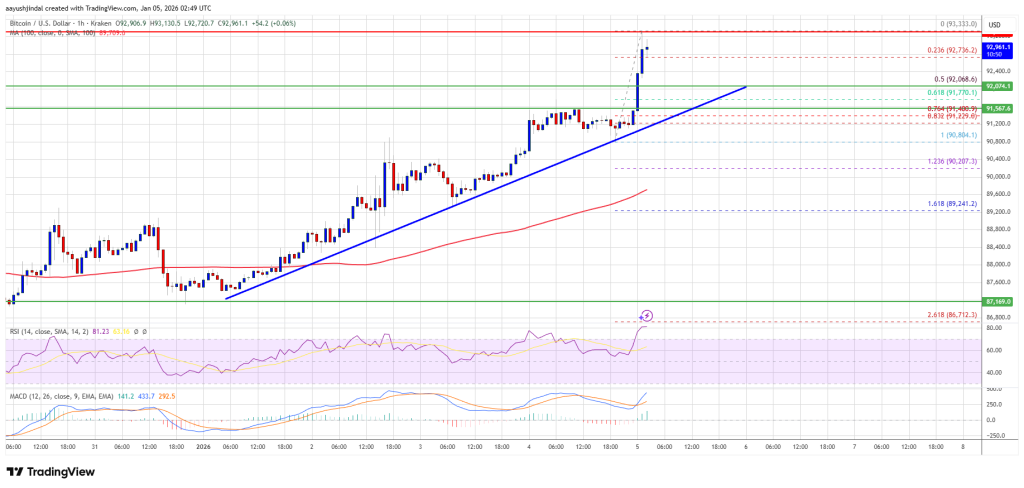
- The price is trading above $92,000 and the 100 hourly Simple Moving Average.
- A major bullish trendline is forming with support at $91,500 on the hourly chart of the BTC/USD pair (data feed from Kraken).
- The pair could continue to rise if it remains above the $91,200 zone.
Bitcoin price has more advantages
Bitcoin price remained above the $90,000 zone and started a new increase. BTC gained pace and rose above the USD 90,500 and USD 91,200 resistance levels.
It even surpassed $92,000. A new multi-week high was reached at $93,333 and the price is now consolidating gains. It is steady above the 23.6% Fib retracement level of the recent upward move from the $90,804 swing low to the $93,333 high.
Bitcoin is now trading above $92,000 and the 100 hourly Simple Moving Average. Moreover, a major bullish trendline is forming with support at $91,500 on the hourly chart of the BTC/USD pair.
If the price remains stable above $91,500, another recovery wave could take place. The immediate resistance is near the $93,200 level. The first major resistance is around the $93,500 level. The next resistance could be $94,000. A close above the USD 94,000 resistance could send the price rising further.
In the mentioned case, the price could rise and test the USD 94,650 resistance. Any further gains could send the price towards the $95,000 level. The next threshold for the bulls could be $95,500 and $95,800.
Another drop in BTC?
If Bitcoin fails to rise above the USD 93,200 resistance zone, it could trigger another decline. The immediate support is near the $92,200 level. The first major support is near the $92,000 level or the 50% Fib retracement level of the recent upward move from the $90,804 swing low to the $93,333 high.
The next support is now near the $91,500 zone. Any further losses could send the price towards the USD 90,500 support in the short term. The key support is at $90,000, below which BTC could potentially accelerate lower in the near term.
Technical indicators:
Hourly MACD – The MACD is now gaining speed in the bullish zone.
Hourly RSI (Relative Strength Index) – The RSI for BTC/USD is now above the 50 level.
Major support levels – USD 92,000, followed by USD 91,500.
Major resistance levels – $93,200 and $94,000.