

Bitcoin price remained above the USD 68,500 support zone. BTC is now consolidating and could aim for another rise above the USD 70,150 resistance.
- Bitcoin found support near $68,500 and started a decent recovery wave.
- The price is trading below $70,000 and the 100 hourly Simple Moving Average.
- A major bullish trendline is forming with support at $69,500 on the hourly chart of the BTC/USD pair (data feed from Kraken).
- The pair could fall again if there is no move above the $70,150 resistance.
Bitcoin price faces resistance
Bitcoin price extended its decline below the USD 70,000 support zone. BTC even fell below the USD 69,500 level before the bulls appeared near USD 68,500. A low was formed at $68,409 and the price is now trying to make a recovery wave.
There was a move above the USD 69,250 resistance zone. The price climbed above the 23.6% Fib retracement level of the downward move from the $71,900 swing high to the $68,409 low.
Bitcoin is now trading below $70,000 and the 100 hourly Simple Moving Average. However, a major bullish trendline is forming with support at $69,500 on the hourly chart of the BTC/USD pair. On the upside, the price is facing resistance around the $70,000 level.
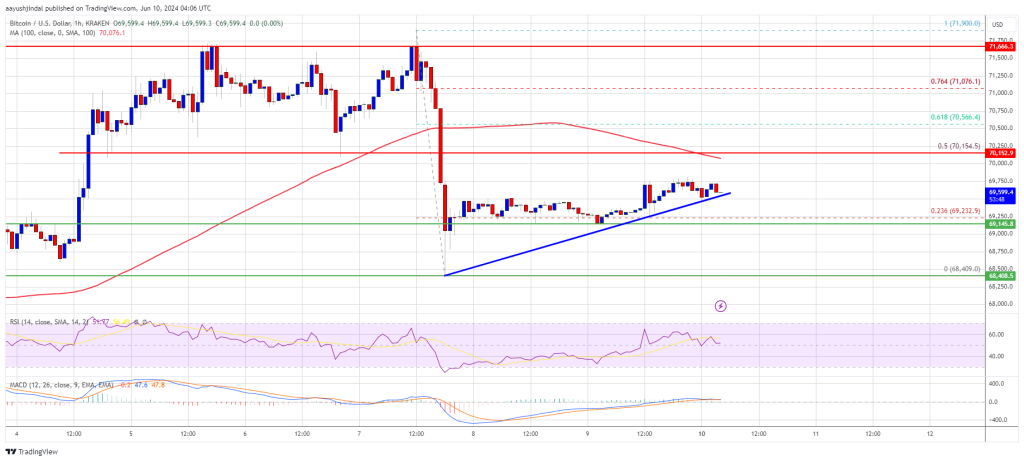
The first major resistance could be at $70,150 and the 50% Fib retracement level of the downward move from the $71,900 swing high to the $68,409 low. The next major resistance could be at USD 70,550. A clear move above the USD 70,550 resistance could push the price higher. In the mentioned case, the price could rise and test the USD 71,200 resistance. Even more gains could send BTC towards the USD 72,000 resistance.
Another drop in BTC?
If Bitcoin fails to climb above the USD 70,150 resistance zone, it could trigger another decline. The immediate downside support is near the $69,500 level and the trendline.
The first major support is at $69,150. The next support is now near $68,500. Any further losses could send the price towards the $67,500 support zone in the near term.
Technical indicators:
Hourly MACD – The MACD is now losing pace in the bearish zone.
Hourly RSI (Relative Strength Index) – The RSI for BTC/USD is now above the 50 level.
Major support levels – USD 69,500, followed by USD 68,500.
Major resistance levels – $70,150 and $70,500.