

Bitcoin price remained above the USD 90,000 support zone. BTC is now rising and could soon aim for an upside break above the USD 94,000 resistance.
- Bitcoin started a downward correction from the $94,500 zone.
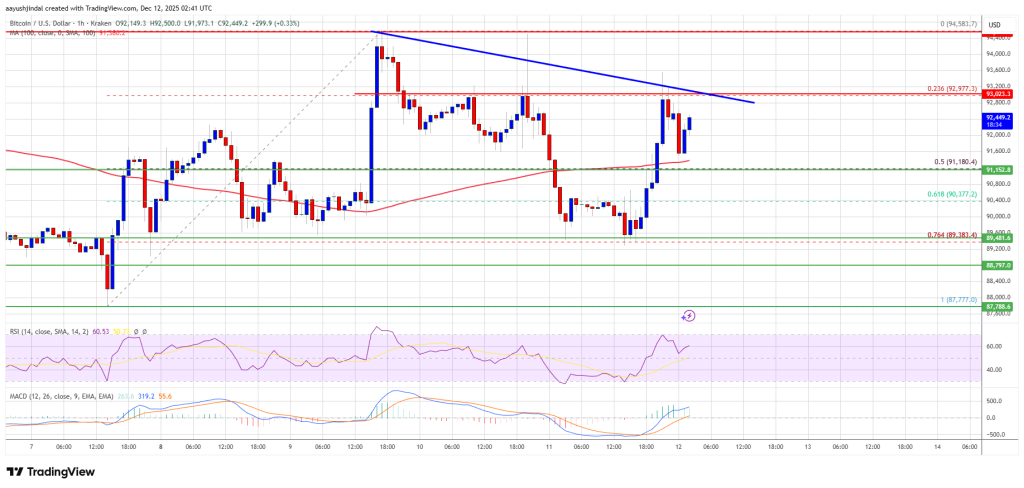
- The price is trading above $92,000 and the 100 hourly Simple Moving Average.
- A bearish trendline is forming with resistance at $92,950 on the hourly chart of the BTC/USD pair (data feed from Kraken).
- The pair could continue to rise if it breaks above the $93,500 zone.
Bitcoin price aims for an upside breakout
Bitcoin price failed to gain momentum for a move above the USD 94,000 and USD 94,500 levels. BTC initiated a downside correction and traded below the USD 92,500 support.
There was a clear move below the 50% Fib retracement level of the upward move from the $87,776 swing low to the $94,582 high. The price even peaked below the $90,000 support. However, the bulls were active near the $89,500 zone.
They prevented a move below the 76.4% Fib retracement level on the upward move from the $87,776 swing low to the $94,582 high. Bitcoin is now trading above $92,000 and the 100 hourly Simple Moving Average.
If the bulls remain in action, the price may try to rise again. The immediate resistance is near the $93,000 level. A bearish trendline is also forming with resistance at $92,950 on the hourly chart of the BTC/USD pair. The first major resistance is near the $93,500 level.
The next resistance could be $94,000. A close above the USD 94,000 resistance could send the price rising further. In the mentioned case, the price could rise and test the USD 94,750 resistance. Any further gains could send the price towards the $95,000 level. The next barrier for the bulls could be $96,000 and $96,500.
Another drop in BTC?
If Bitcoin fails to rise above the USD 93,000 resistance zone, it could trigger another decline. Immediate support is approaching the $92,000 level. The first major support is near the $91,200 level.
The next support is now near the $90,000 zone. Any further losses could send the price towards the USD 89,500 support in the short term. The key support is at $88,000, below which BTC could potentially accelerate lower in the near term.
Technical indicators:
Hourly MACD – The MACD is now gaining speed in the bullish zone.
Hourly RSI (Relative Strength Index) – The RSI for BTC/USD is now above the 50 level.
Major support levels – USD 91,200, followed by USD 90,000.
Major resistance levels – $93,000 and $94,000.