

Bitcoin price extended its losses and traded below the USD 64,500 level. BTC corrects losses, but the bears are still in control and aiming for more losses.
- Bitcoin remained in a bearish zone and traded below $64,500.
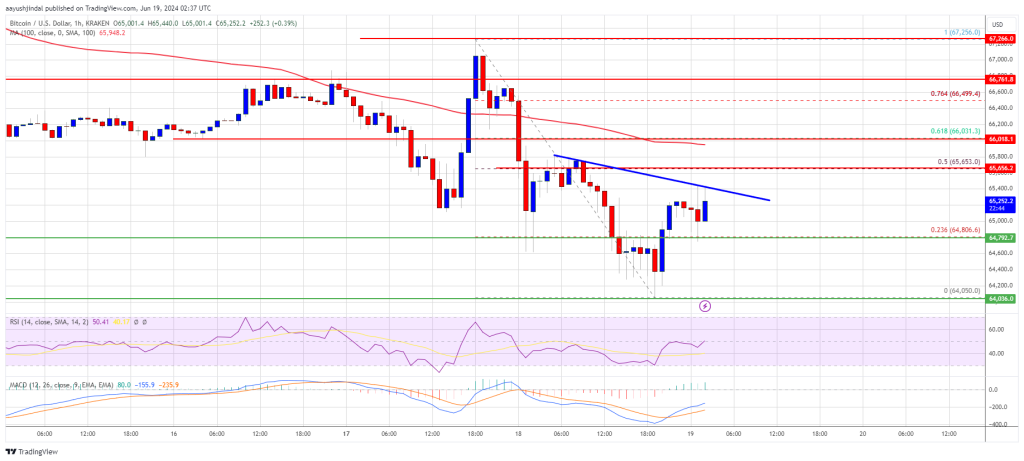
- The price is trading below $65,500 and the 100 hourly Simple Moving Average.
- A connecting trendline is forming with resistance at $65,400 on the hourly chart of the BTC/USD pair (data feed from Kraken).
- The pair remains at risk of more negative points below the $64,000 support zone.
Bitcoin price continues to fall
Bitcoin price remained in a bearish zone after settling below the USD 66,500 resistance zone. BTC extended losses and traded below the USD 65,000 level. There was also a dip below $64,500.
A low was formed at $64,050 and the price is now correcting losses. There was a small recovery above the USD 64,500 level. The price climbed above the 23.6% Fib retracement level of the downwave from the $67,255 swing high to the $64,050 low.
Bitcoin is now trading below $65,500 and the 100 hourly Simple Moving Average. A connecting trendline is also forming with resistance at $65,400 on the hourly chart of the BTC/USD pair.
On the upside, the price is facing resistance near the $65,500 level and trendline. The first major resistance could be $65,650, or the 50% Fib retracement level of the downward wave from the $67,255 swing high to the $64,050 low. The next major resistance could be at USD 66,000.
A clear move above the USD 66,000 resistance could trigger a significant upside and send the price higher. In the mentioned case, the price could rise and test the USD 66,500 resistance. Any further gains could send BTC towards the USD 67,500 resistance in the short term.
Lose more in BTC?
If Bitcoin fails to climb above the USD 65,400 resistance zone, it could trigger another decline. The immediate downside support is near the $64,800 level.
The first major support is at $64,200. The next support is now near $64,000. Any further losses could send the price towards the $63,200 support zone in the near term.
Technical indicators:
Hourly MACD – The MACD is now losing pace in the bearish zone.
Hourly RSI (Relative Strength Index) – The RSI for BTC/USD is now approaching the 50 level.
Major support levels – USD 64,500, followed by USD 64,000.
Major resistance levels – $65,400 and $66,000.