

Bitcoin price started a consolidation phase below $92,000. BTC is holding the USD 89,500 support and could try to start another increase.
- Bitcoin started a recovery wave above $90,000 and $90,500.
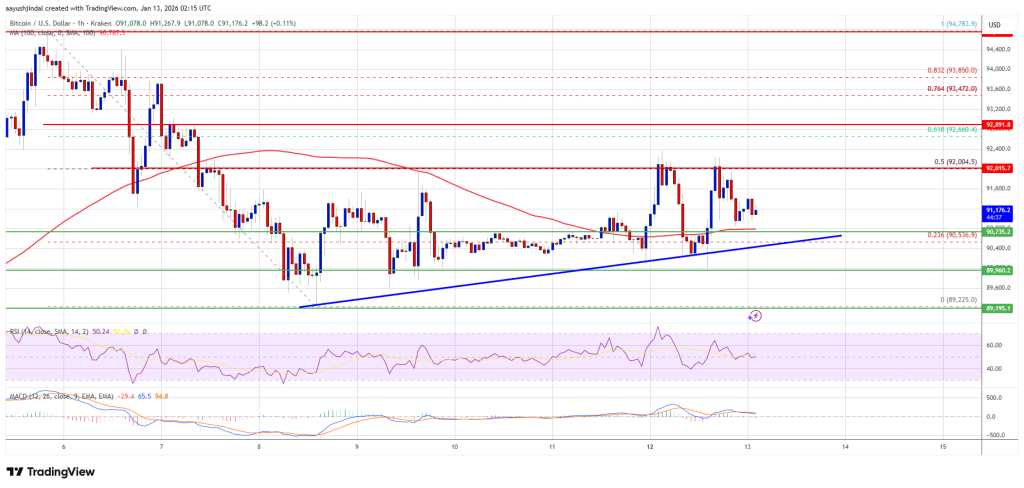
- The price is trading above $91,000 and the 100 hourly Simple Moving Average.
- A bullish trendline is forming with support at $90,650 on the hourly chart of the BTC/USD pair (data feed from Kraken).
- The pair could continue to rise if it remains above the $90,000 zone.
Bitcoin price remains within a range
Bitcoin price managed to stay above the USD 89,500 support and initiated a small recovery wave. BTC was able to settle above $90,000 and $90,500.
The bulls were able to push the price above $91,500, and the 23.6% Fib retracement level of the downward move from the $93,770 swing high to the $89,225 low. However, the price seems to be facing a major hurdle near the USD 92,000 level.
The 50% Fib retracement level of the downward move from the $93,770 swing high to the $89,225 low acts as resistance. Furthermore, a bullish trendline is forming with support at $90,650 on the hourly chart of the BTC/USD pair.
Bitcoin is now trading above $91,000 and the 100 hourly Simple Moving Average. If the price remains stable above $90,500, another increase could be attempted. The immediate resistance is near the $92,000 level. The first major resistance is near the $92,800 level.
The next resistance could be $93,450. A close above the resistance at $93,450 could send the price higher. In the mentioned case, the price could rise and test the USD 94,000 resistance. Any further gains could send the price towards the USD 94,500 level. The next barrier for the bulls could be $95,000 and $95,500.
Another drop in BTC?
If Bitcoin fails to rise above the USD 92,000 resistance zone, it could trigger another decline. Immediate support is near the $91,000 level. The first major support is near the $90,650 level and trendline.
The next support is now near the $90,000 zone. Any further losses could send the price towards the USD 89,500 support in the short term. The key support is at $89,250, below which BTC could potentially accelerate lower in the near term.
Technical indicators:
Hourly MACD – The MACD is now losing pace in the bullish zone.
Hourly RSI (Relative Strength Index) – The RSI for BTC/USD is now approaching the 50 level.
Major support levels – USD 91,000, followed by USD 90,650.
Major resistance levels – $92,000 and $92,800.