

Bitcoin price started a recovery wave above $88,000. BTC is now consolidating and could soon aim for a move above the $90,000 zone.
- Bitcoin started a recovery wave and climbed towards $89,000.
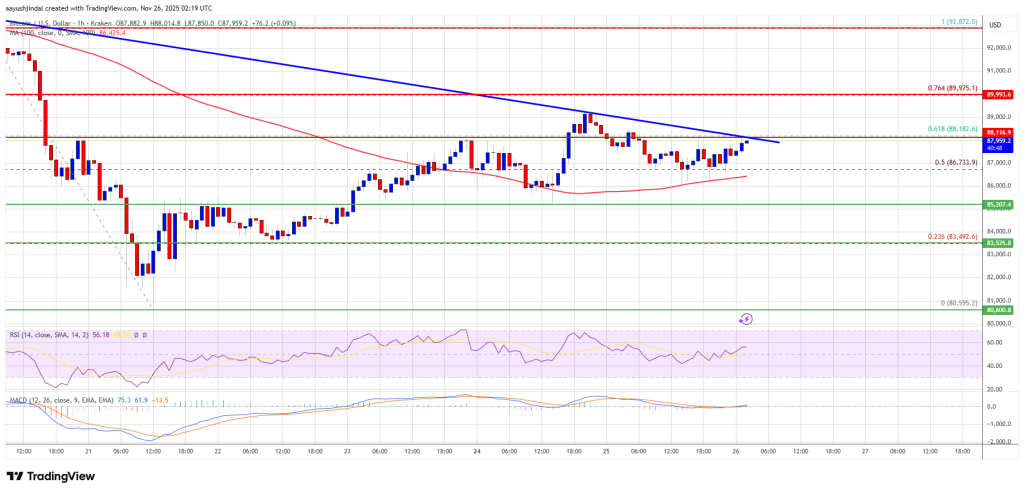
- The price is trading above USD 87,000 and the 100 hourly Simple Moving Average.
- A bearish trendline is forming with resistance at $88,200 on the hourly chart of the BTC/USD pair (data feed from Kraken).
- The pair could continue to rise if it breaks above the $90,000 zone.
Bitcoin Price Eyes Upside Breakout
Bitcoin price managed to remain above the USD 83,500 level. BTC formed a base and recently started a recovery wave above the $85,500 resistance zone.
There was a move above the USD 86,000 resistance zone. The bulls pushed the price above the 50% Fib retracement level of the downward move from the $92,872 swing high to the $80,595 low. However, the bears are currently preventing an upside break above the $90,000 zone.
Furthermore, a bearish trendline is forming with resistance at $88,200 on the hourly chart of the BTC/USD pair. Bitcoin is now trading above $87,000 and the 100 hourly Simple Moving Average.
If the bulls attempt another recovery wave, the price may encounter resistance near the USD 88,200 level. The first major resistance is around the $89,000 level. The next resistance could be $90,000 or the 76.4% Fib retracement level of the downward move from the $92,872 swing high to the $80,595 low.
A close above the USD 90,000 resistance could send the price rising further. In the mentioned case, the price could rise and test the USD 91,750 resistance. Any further gains could send the price towards the USD 92,500 level. The next barrier for the bulls could be $93,500 and $94,000.
Another drop in BTC?
If Bitcoin fails to rise above the $90,000 resistance zone, it could trigger another decline. Immediate support is near the $86,700 level. The first major support is near the $86,200 level.
The next support is now near the $85,000 zone. Any further losses could send the price towards the USD 83,500 support in the short term. The key support is at $82,000, below which BTC could potentially accelerate lower in the near term.
Technical indicators:
Hourly MACD – The MACD is now gaining speed in the bullish zone.
Hourly RSI (Relative Strength Index) – The RSI for BTC/USD is now above the 50 level.
Major support levels – USD 86,200, followed by USD 85,000.
Major resistance levels – $89,000 and $90,000.