

Bitcoin price tried to start a new increase but failed at $89,250. BTC is now consolidating below $89,000 and could respond to the downtrend.
- Bitcoin started a recovery wave above the $86,800 zone.
- The price is trading above USD 87,000 and the 100 hourly Simple Moving Average.
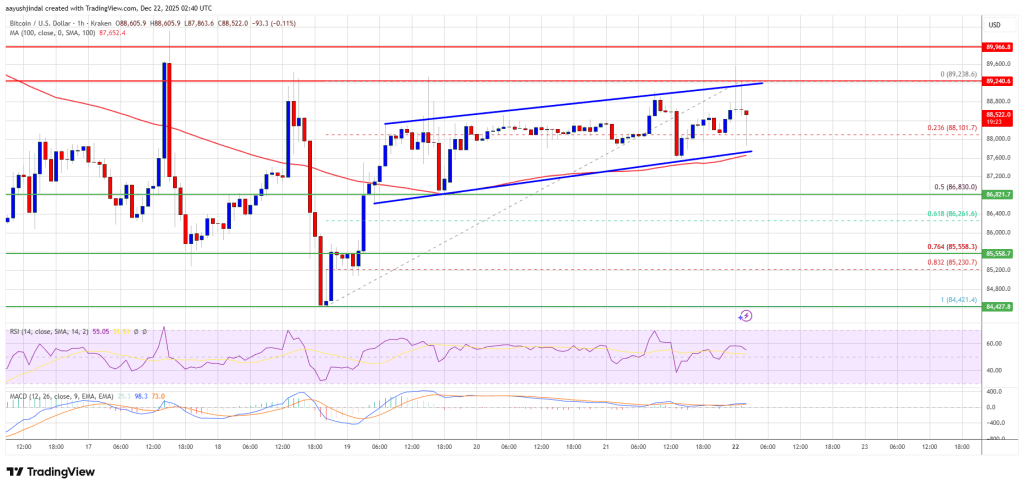
- A major ascending channel is forming with support at $87,650 on the hourly chart of the BTC/USD pair (data feed from Kraken).
- The pair could continue to rise if it breaks above the $89,500 zone.
Bitcoin price faces resistance
Bitcoin price made another recovery wave above USD 88,200 and USD 89,000. BTC tested the USD 89,250 resistance zone and struggled to hold higher.
The price is now consolidating gains below $89,000. There was a small decline and it tested the 23.6% Fib retracement level of the upward move from the $84,421 swing low to the $89,238 high. However, the bulls are active above $87,500.
Bitcoin is now trading above $87,500 and the 100 hourly Simple Moving Average. A major ascending channel is also forming with support at $87,650 on the hourly chart of the BTC/USD pair.
If the bulls stay in action, the price could make more gains. The immediate resistance is near the $89,000 level. The first major resistance is around the $89,250 level. The next resistance could be $89,500. A close above the resistance at $89,500 could send the price higher. In the mentioned case, the price could rise and test the USD 90,500 resistance. Any further gains could send the price towards the USD 92,000 level. The next threshold for the bulls could be $92,650 and $93,200.
Another drop in BTC?
If Bitcoin fails to rise above the $89,000 resistance zone, it could trigger another decline. Immediate support is near the $87,500 level. The first major support is near the $87,000 level.
The next support now lies near the $86,800 zone and the 50% Fib retracement level of the upward move from the $84,421 swing low to the $89,238 high. Any further losses could send the price towards the USD 85,500 support in the short term. The key support is at $84,400, below which BTC could potentially accelerate lower in the near term.
Technical indicators:
Hourly MACD – The MACD is now losing pace in the bullish zone.
Hourly RSI (Relative Strength Index) – The RSI for BTC/USD is now above the 50 level.
Major support levels – USD 87,500, followed by USD 86,800.
Major resistance levels – $89,000 and $89,500.