

Bitcoin price started a recovery wave from $86,000. BTC is slowly rising and could rise further if it clears $89,500.
- Bitcoin started a small recovery wave from the $86,000 level.
- The price is trading near $88,500 and the 100 hourly simple moving average.
- There was a break above a bearish trendline with resistance at $88,000 on the hourly chart of the BTC/USD pair (data feed from Kraken).
- The pair could recover if it manages to finish above $88,800 and $89,500.
Bitcoin price tries to recover
Bitcoin price extended losses and traded below the USD 87,200 support. BTC even fell below $86,500 before the bulls appeared. A low was formed at $86,007, and the price is now trying to make a recovery wave.
The price climbed above the USD 87,000 and USD 87,500 levels. There was a move above the 50% Fib retracement level of the downward move from the $91,099 swing high to the $86,007 low. Moreover, there was a break above a bearish trendline with resistance at $88,000 on the hourly chart of the BTC/USD pair.
Bitcoin is now trading near $88,500 and the 100 hourly moving average. If the price remains stable above $87,500, another move up could be attempted. The immediate resistance is near the $88,800 level.
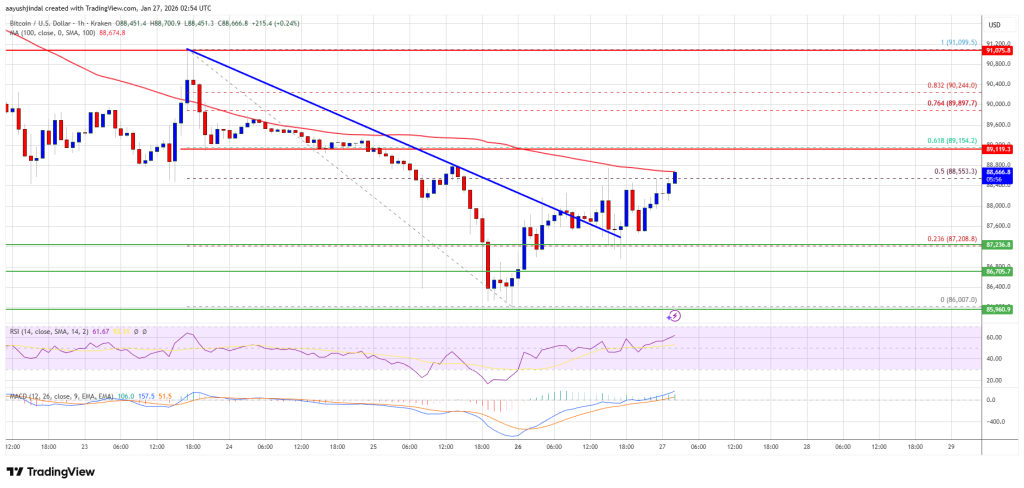
The first major resistance is near the $89,150 level as it is close to the 61.8% Fib retracement level of the downward move from the $91,099 swing high to the $86,007 low. A close above the resistance at $89,150 could send the price higher. In the mentioned case, the price could rise and test the USD 89,500 resistance. Any further gains could send the price towards the $90,000 level. The next barrier for the bulls could be $91,000 and $91,500.
Another drop in BTC?
If Bitcoin fails to rise above the USD 88,800 resistance zone, it could trigger another decline. Immediate support is near the $88,000 level. The first major support is near the $87,200 level.
The next support is now near the $86,700 zone. Any further losses could send the price towards the USD 86,200 support in the near term. The key support is at $86,000, below which BTC could struggle to recover in the near term.
Technical indicators:
Hourly MACD – The MACD is now gaining speed in the bullish zone.
Hourly RSI (Relative Strength Index) – The RSI for BTC/USD is now above the 50 level.
Major support levels – USD 88,000, followed by USD 87,200.
Major resistance levels – $88,800 and $89,500.