

Bitcoin price found support near the $63,500 zone. BTC is now rising and showing positive signals above the USD 65,500 resistance zone.
- Bitcoin formed a base and started a new rise above the $65,000 resistance zone.
- The price is trading above $65,500 and the 100 hourly Simple Moving Average.
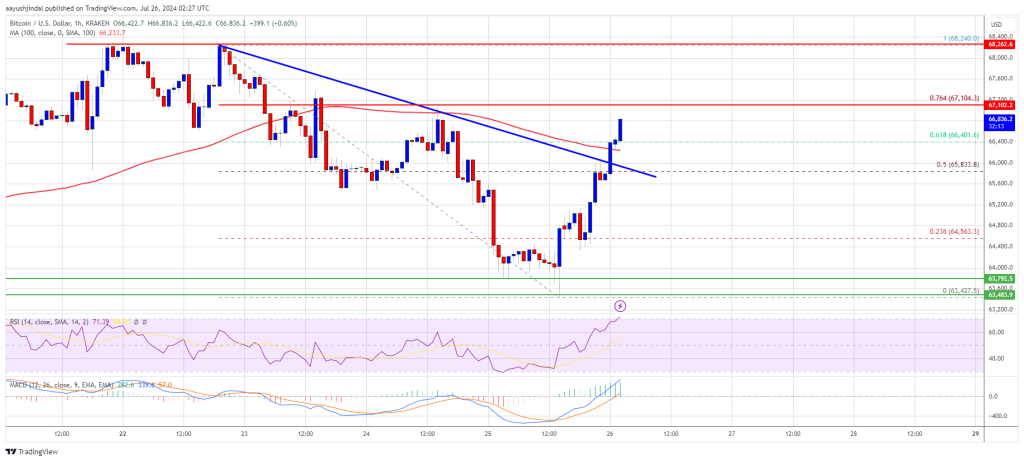
- There was a break above a key bearish trendline with resistance at $66,000 on the hourly chart of the BTC/USD pair (data feed from Kraken).
- The pair could accelerate higher towards the USD 67,500 and USD 68,000 levels in the near term.
Bitcoin Price Gains Strength and Rises 4%
Bitcoin price extended losses and traded below the USD 64,200 level. However, BTC bulls were active around the $63,500 level. A low was formed at $63,427 and the price recently started a new increase.
There was a move above the USD 64,500 and USD 65,000 resistance levels. The price climbed above the 50% Fib retracement level of the downward move from the $68,240 swing high to the $63,427 low. Additionally, there was a break above a key bearish trendline with resistance at $66,000 on the hourly chart of the BTC/USD pair.
Bitcoin price is now trading above $65,500 and the 100 hourly Simple Moving Average. If the price continues to rise, it could face resistance near the $67,000 level or the 76.4% Fib retracement level of the downward move from the $68,240 swing high to the $63,427 low.
The first major resistance is around the $67,500 level. A clear move above the USD 67,500 resistance could push the price further higher in the coming sessions. The next major resistance could be at USD 68,000. The next big hurdle is at $68,500. A close above the resistance at $68,500 could trigger bullish moves. In the mentioned case, the price could rise and test the USD 70,000 resistance.
Another drop in BTC?
If Bitcoin fails to recover above the $67,000 resistance zone, it could trigger another decline. The immediate downside support is near the $66,400 level and the 100 hourly Simple Moving Average.
The first major support is at $65,500. The next support is now near $65,000. Any further losses could send the price towards the $63,500 support zone in the near term.
Technical indicators:
Hourly MACD – The MACD is now gaining speed in the bullish zone.
Hourly RSI (Relative Strength Index) – The RSI for BTC/USD is now above the 50 level.
Major support levels – USD 66,400, followed by USD 65,500.
Major resistance levels – $67,000 and $68,000.