

Bitcoin price is trying to make a fresh rise above the USD 52,000 resistance. BTC needs to overcome the USD 52,800 resistance to continue higher in the near term.
- Bitcoin price is rapidly gaining above the USD 52,800 resistance zone.
- The price is trading above $52,000 and the 100 hourly Simple Moving Average.
- There was a break above a key bearish trendline with resistance at $51,880 on the hourly chart of the BTC/USD pair (data feed from Kraken).
- The pair could continue to rise if it breaks the $52,800 resistance zone.
Bitcoin price sees more gains
Bitcoin price started a downward correction from the USD 52,800 resistance zone. BTC corrected lower below the USD 52,000 and USD 51,500 levels. However, the bulls were active above the $50,500 zone.
A low was formed near USD 50,581 and the price is now trying to make a new increase. There was a move above the USD 51,200 and USD 51,500 resistance levels. The price reached the 50% Fib retracement level of the downward move from the $52,843 swing high to the $50,581 low.
Additionally, there was a break above a key bearish trendline with resistance at $51,880 on the hourly chart of the BTC/USD pair. Bitcoin is now trading above $52,000 and the 100 hourly Simple Moving Average.
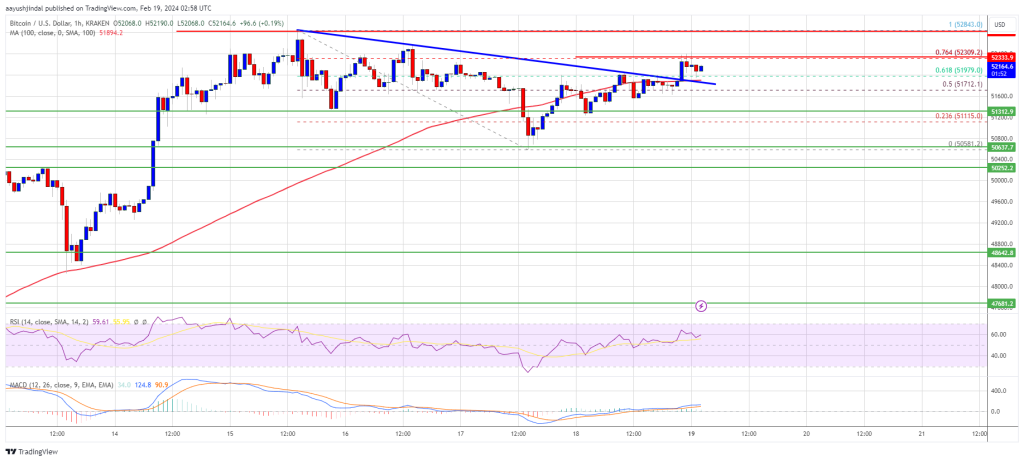
Source: BTCUSD on TradingView.com
The immediate resistance is near the $52,300 level. It is close to the 76.4% Fib retracement level of the downward move from the $52,843 swing high to the $50,581 low. The next major resistance could be at USD 52,800, above which the price could continue its rally. The next stop for the bulls could be as high as $53,200. A clear move above the USD 53,200 resistance could send the price towards the USD 54,000 resistance. The next resistance could be near the USD 55,000 level.
Another drop in BTC?
If Bitcoin fails to rise above the USD 52,300 resistance zone, it could start another downside correction in the near term. The immediate downside support is near the $51,850 level and the trendline.
The first major support is at $51,300. If there is a close below $51,300, the price may gain bearish momentum. In the mentioned case, the price could decline towards the USD 50,500 support zone.
Technical indicators:
Hourly MACD – The MACD is now gaining speed in the bullish zone.
Hourly RSI (Relative Strength Index) – The RSI for BTC/USD is now above the 50 level.
Major support levels – USD 51,850, followed by USD 51,300.
Major resistance levels – $52,300, $52,800 and $54,000.
Disclaimer: The article is for educational purposes only. It does not represent NewsBTC’s views on buying, selling or holding investments and of course investing involves risks. You are advised to conduct your own research before making any investment decisions. Use the information on this website entirely at your own risk.