

Bitcoin price gained bearish momentum below the $29,000 support. BTC tested USD 28,400 and it is now at risk of more losses below USD 28,200.
- Bitcoin is trading with a bearish angle below the USD 29,250 resistance zone.
- The price is trading below $29,000 and the 100 Simple hourly moving average.
- A major bearish trendline is forming with resistance near USD 28,850 on the BTC/USD pair hourly chart (Kraken data feed).
- The pair could drop further and trade below the USD 28,200 support.
Bitcoin price is hit
Bitcoin price remained in a bearish zone below the USD 29,250 resistance zone. BTC started falling again and traded below the key $29,000 support zone.
It opened the doors for a sharp drop and the price dropped below $28,500. A low is forming near USD 28,350 and the price is now consolidating losses. It is trading near the 23.6% Fib retracement level from the recent drop from the $29,182 swing high to the $28,350 low.
Bitcoin is now trading below $29,000 and the 100 simple hourly moving average. A major bearish trendline is also forming with resistance near USD 28,850 on the hourly chart of the BTC/USD pair.
Immediate resistance is near the $28,750 level. The next major resistance is near $28,850 and the trendline. It is close to the 61.8% Fib retracement level of the recent drop from the $29,182 swing high to the $28,350 low. The main resistance is now forming near the $29,000 zone and the 100 simple hourly moving average.
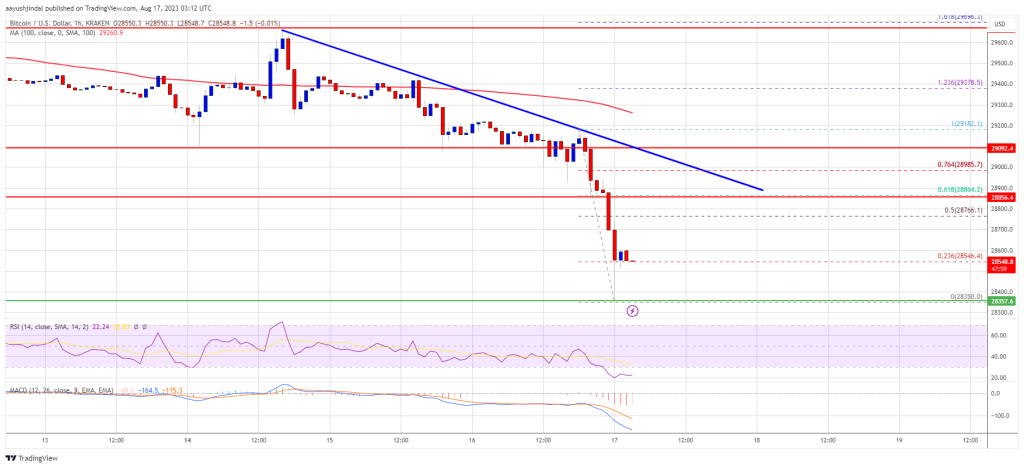
Source: BTCUSD at TradingView.com
A close above the $29,000 resistance could start a decent rise towards the $29,500 resistance zone. More winnings could set the pace for a bigger increase towards $30,000.
Lose more in BTC?
If Bitcoin fails to clear the USD 28,850 resistance, it could decline further. Immediate support on the downside is near the $28,400 zone.
The next major support is near the $28,200 level. A downside break below the $28,200 level could push the price further into a bearish zone. In the said case, the price could drop to $27,500.
Technical indicators:
Hourly MACD – The MACD is now gaining pace in the bearish zone.
Hourly RSI (Relative Strength Index) – The RSI for BTC/USD is now below the 50 level.
Major Support Levels – $28,400 followed by $28,200.
Major resistance levels – $28,750, $28,850 and $29,000.