

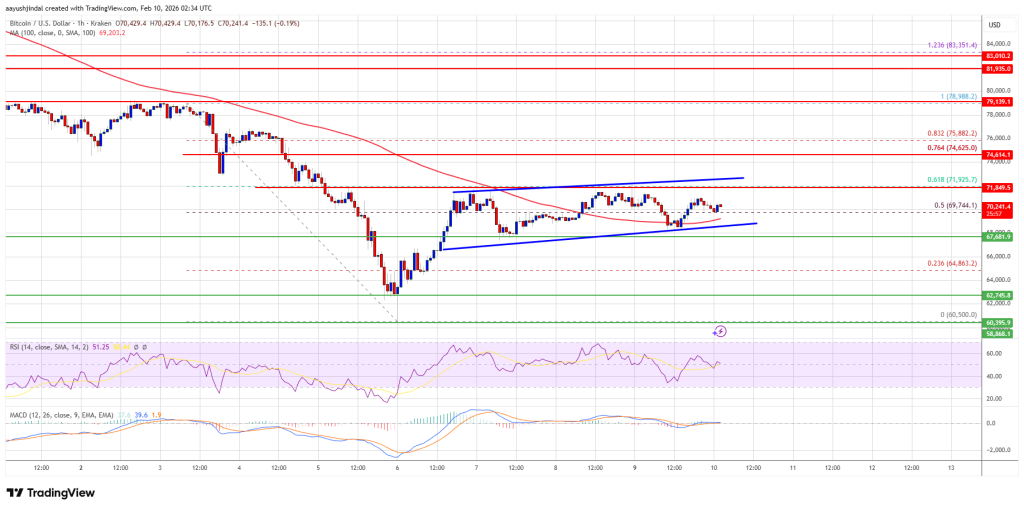
Bitcoin price started a recovery wave above $68,000. BTC is now consolidating gains above $70,000 and facing hurdles near the $72,200 zone.
- Bitcoin is trying to recover but is facing many hurdles around $72,000.
- The price is trading above $70,000 and the 100 hourly moving average.
- A rising channel is forming with support at $68,800 on the hourly chart of the BTC/USD pair (data feed from Kraken).
- The pair could fall again if it trades below the $68,800 and $67,700 levels.
Bitcoin price remains within a range
Bitcoin price remained steady above the $66,000 zone. BTC started a recovery wave and was able to climb above the USD 68,800 resistance zone.
The price surpassed the 50% Fib retracement level of the key slide from the $78,988 swing high to the $60,500 low. However, the bears seem to be active around the USD 72,000 and USD 72,500 levels. Moreover, an ascending channel is forming with support at $68,800 on the hourly chart of the BTC/USD pair.
Bitcoin is now trading above $70,000 and the 100 hourly moving average. If the price holds steady above $68,800, another move up could be attempted. Immediate resistance is near the $72,000 level or the 61.8% Fib retracement level of the main slide from the $78,988 swing high to the $60,500 low.
The first major resistance is around the $72,500 level. A close above the USD 72,500 resistance could send the price rising further. In the mentioned case, the price could rise and test the USD 74,650 resistance. Any further gains could send the price towards the USD 75,880 level. The next threshold for the bulls could be $76,500 and $77,200.
Another drop in BTC?
If Bitcoin fails to rise above the USD 72,500 resistance zone, it could trigger another decline. Immediate support is near the $69,400 level. The first major support is near the $68,500 level.
The next support is now near the $67,600 zone. Any further losses could send the price towards the USD 66,500 support in the short term. The key support now lies at $65,000, below which BTC could struggle to recover in the near term.
Technical indicators:
Hourly MACD – The MACD is now losing pace in the bearish zone.
Hourly RSI (Relative Strength Index) – The RSI for BTC/USD is now above the 50 level.
Major support levels – USD 68,500, followed by USD 67,600.
Major resistance levels – $72,000 and $72,500.