

Bitcoin price gained speed and tested the USD 65,000 resistance. BTC needs to clear $65,000 to continue higher in the near term.
- Bitcoin started a steady rise above the $63,000 zone.
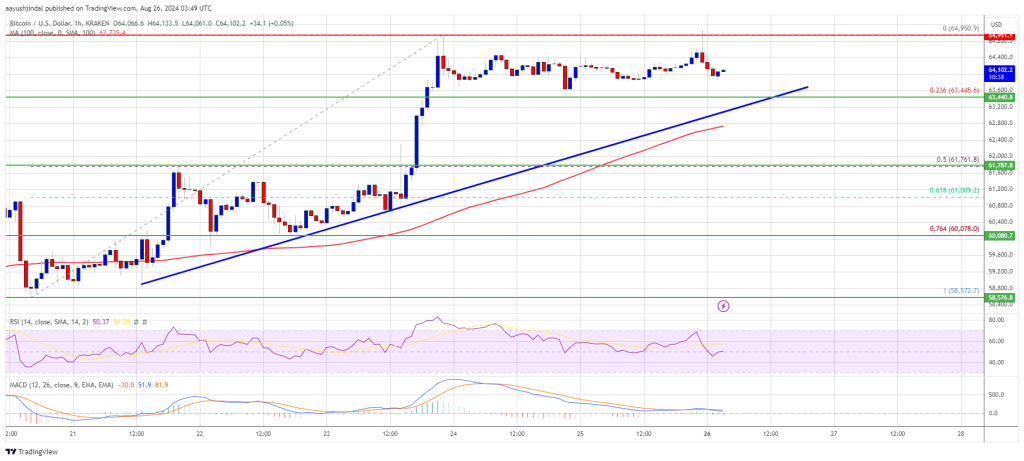
- The price is trading above USD 63,500 and the 100 hourly Simple Moving Average.
- A major bullish trendline is forming with support at $63,450 on the hourly chart of the BTC/USD pair (data feed from Kraken).
- The pair could attempt another rise if it breaks the $65,000 resistance zone.
Bitcoin price sees more gains
Bitcoin price held steady above the $60,000 pivot level. BTC formed a base and started a steady rise above the USD 62,000 resistance zone. The price climbed above the USD 63,200 and USD 63,500 resistance levels.
Finally, the bears appeared near the USD 65,000 resistance zone. It reached a high at $64,950 and the price is now consolidating gains. There was a small decline below the USD 64,500 level. The price tested the 23.6% Fib retracement level of the upward move from the $58,572 swing low to the $64,950 high.
Bitcoin is now trading above $63,200 and the 100 hourly Simple Moving Average. A major bullish trendline is also forming with support at $63,450 on the hourly chart of the BTC/USD pair.
On the upside, the price could encounter resistance near the USD 64,500 level. The first major resistance is around the $65,000 level. A clear move above the USD 65,000 resistance could push the price further higher in the coming sessions. The next major resistance could be at USD 65,500.
A close above the $65,500 resistance could provide more upside. In the mentioned case, the price could rise and test the USD 67,200 resistance.
Another drop in BTC?
If Bitcoin fails to rise above the $65,000 resistance zone, a downward correction could occur. The immediate downside support is near the $63,800 level.
The first major support is at $63,500. The next support is now near the $62,800 zone. Any further losses could send the price towards the $61,750 support zone or the 50% Fib retracement level of the upward move from the $58,572 swing low to the $64,950 high in the near term.
Technical indicators:
Hourly MACD – The MACD is now losing pace in the bullish zone.
Hourly RSI (Relative Strength Index) – The RSI for BTC/USD is now above the 50 level.
Major support levels – USD 63,800, followed by USD 63,500.
Major resistance levels – $64,500 and $65,000.