

Bitcoin price attempted to make another surge above $34,500. BTC could start a major downside correction if there is a close below the 100 hourly SMA.
- Bitcoin is still struggling to overcome the $35,000 resistance.
- The price is trading above USD 34,200 and the 100 hourly Simple Moving Average.
- A major ascending channel is forming with support near $34,300 on the hourly chart of the BTC/USD pair (data feed from Kraken).
- The pair could fall sharply if it closes below $34,000 and then $33,400.
Bitcoin price provides important support
Bitcoin price started to rise again above the USD 34,200 resistance zone. BTC climbed higher towards the $35,000 resistance zone, but there was a lack of momentum.
The price rose to $34,758 and struggled to stay higher. It is now correcting gains below the USD 34,500 level. There was a move below the 23.6% Fib retracement level of the upward move from the $33,318 swing low to the $34,758 high.
Bitcoin is now trading above $34,200 and the 100 hourly Simple Moving Average. A major ascending channel is also forming with support near $34,300 on the hourly chart of the BTC/USD pair.
On the upside, immediate resistance is around the $34,500 level. The next major resistance could be near $34,750 or the channel’s upper trendline. The main resistance is still near the $35,000 zone. A clear move above the USD 35,000 resistance could trigger another steady rise.
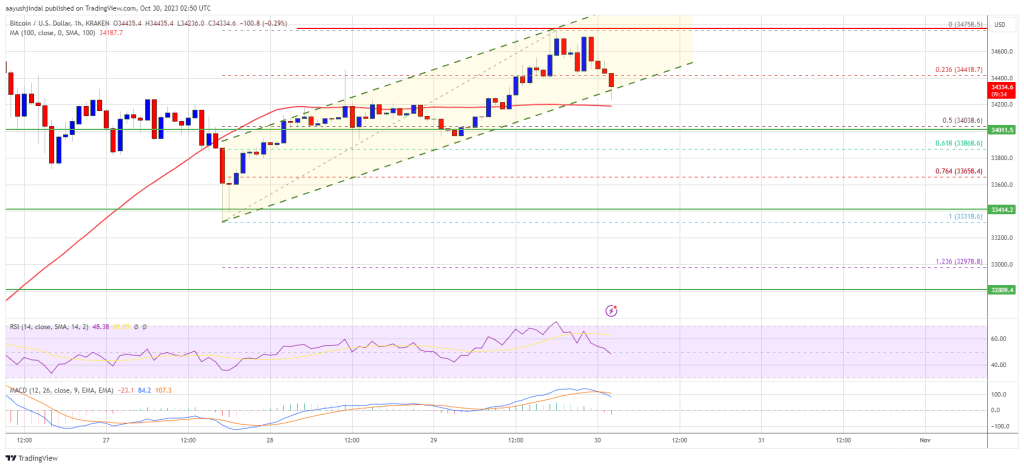
Source: BTCUSD on TradingView.com
The next major resistance could be at USD 35,500, above which the price could test USD 36,200. Any further gains could send BTC towards the $36,500 level in the short term.
Downward correction in BTC?
If Bitcoin fails to rise above the USD 34,750 resistance zone, it could trigger another decline. The immediate downside support is near the $34,200 level and the 100 hourly Simple Moving Average.
The next major support is near the $34,000 level or the 50% Fib retracement level of the upward move from the $33,318 swing low to the $34,758 high. If there is a move below $34,000, there is a risk of more downside. In the mentioned case, the price could drop towards the USD 33,400 level or even USD 32,500.
Technical indicators:
Hourly MACD – The MACD is now losing pace in the bullish zone.
Hourly RSI (Relative Strength Index) – The RSI for BTC/USD is now below the 50 level.
Major support levels – USD 34,200, followed by USD 34,000.
Major resistance levels – $34,500, $34,750 and $35,000.