

Bitcoin price found support and started a recovery wave above $88,000. BTC is now rising and could try to surpass the USD 89,000 resistance.
- Bitcoin started a recovery wave above the $88,000 zone.
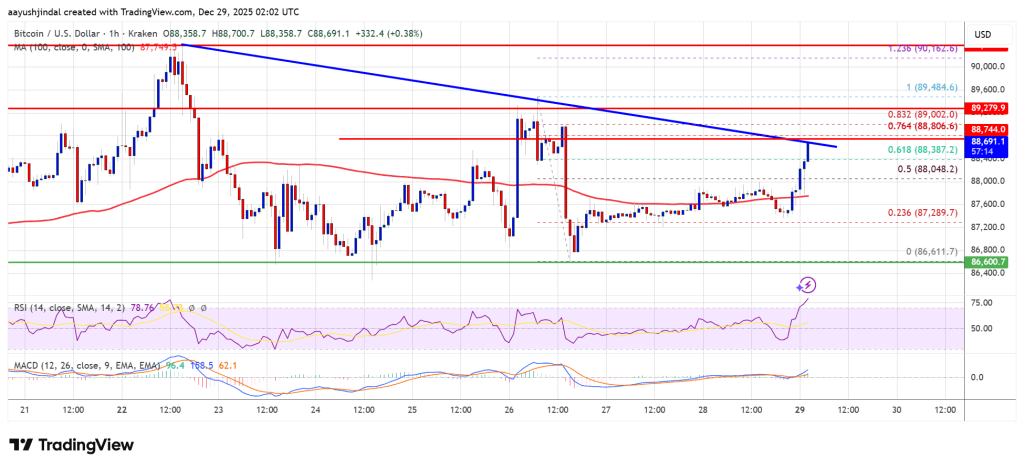
- The price is trading above $88,000 and the 100 hourly Simple Moving Average.
- A bearish trendline is forming with resistance at $88,750 on the hourly chart of the BTC/USD pair (data feed from Kraken).
- The pair could continue to rise if it trades above the $89,500 zone.
Bitcoin price faces resistance
Bitcoin price managed to remain in a positive zone above $85,500 and started a recovery wave. BTC gained pace and rose above the USD 87,000 and USD 87,200 levels.
The price climbed above the 50% Fib retracement level of the downward move from the $89,484 swing high to the $86,611 low. The bulls even pushed the price above $88,000. Bitcoin is now trading above $88,000 and the 100 hourly Simple Moving Average.
If the price remains stable above $88,000, another recovery wave could occur. Immediate resistance is near the $88,750 level and the 76.4% Fib retracement level of the downward move from the $89,484 swing high to the $86,611 low. Furthermore, a bearish trendline is forming with resistance at $88,750 on the hourly chart of the BTC/USD pair.
The first major resistance is around the $89,500 level. The next resistance could be $89,800. A close above the resistance at $89,800 could send the price higher. In the mentioned case, the price could rise and test the USD 90,200 resistance. Any further gains could send the price towards the USD 90,500 level. The next barrier for the bulls could be $91,500 and $92,000.
Another drop in BTC?
If Bitcoin fails to rise above the USD 89,500 resistance zone, it could trigger another decline. Immediate support is near the $88,000 level. The first major support is near the $87,250 level.
The next support is now near the $86,500 zone. Any further losses could send the price towards the USD 85,500 support in the short term. The key support is at $84,500, below which BTC could potentially accelerate lower in the near term.
Technical indicators:
Hourly MACD – The MACD is now gaining speed in the bullish zone.
Hourly RSI (Relative Strength Index) – The RSI for BTC/USD is now above the 50 level.
Major support levels – USD 88,000, followed by USD 87,250.
Major resistance levels – $88,750 and $89,500.