

Bitcoin price has finally cleared the USD 36,000 resistance. BTC is showing positive signs and could continue rising towards the USD 37,500 resistance.
- Bitcoin gained speed and rose above the $36,000 resistance zone.
- The price is trading above USD 36,000 and the 100 hourly Simple Moving Average.
- A major bullish trendline is forming with support near $35,800 on the hourly chart of the BTC/USD pair (data feed from Kraken).
- The pair is consolidating gains and could continue rising towards $37,500.
Bitcoin price soars higher
Bitcoin price remained well above the $35,000 support zone. BTC formed a base above the $35,500 zone and eventually started a decent increase. It broke the key hurdle at $36,000 and started a new rally.
There was a spike towards the $36,500 level. A high is formed near USD 36,525 and the price is now consolidating gains. It is trading above the 23.6% Fib retracement level of the upward move from the $35,100 swing low to the $36,525 high.
Bitcoin is also trading above $36,000 and the 100 hourly Simple Moving Average. Moreover, a major bullish trendline is forming with support around $35,800 on the hourly chart of the BTC/USD pair. The trendline is near the 50% Fib retracement level of the upward move from the $35,100 swing low to the $36,525 high.
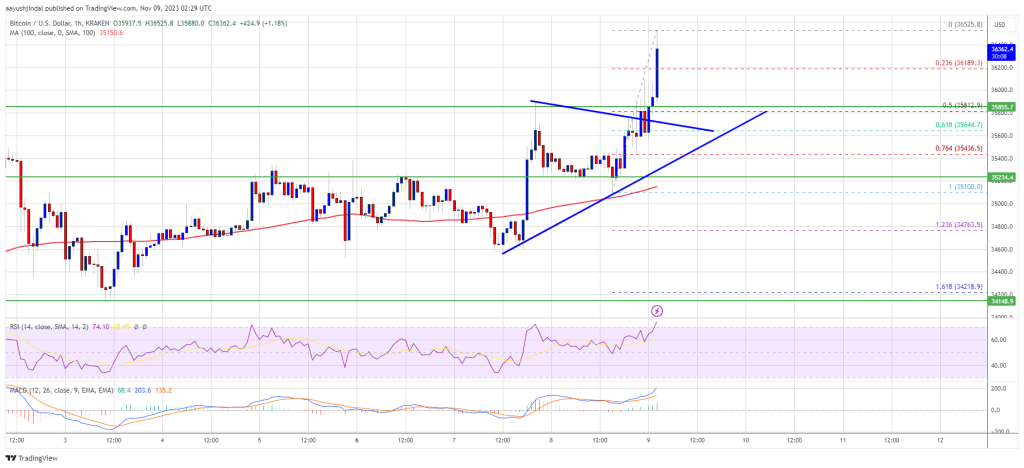
Source: BTCUSD on TradingView.com
On the upside, immediate resistance is around the $36,500 level. The next major resistance could be near USD 37,000, above which the price could accelerate even further. In the said case, it could test the USD 37,500 level. Any further gains could send BTC towards the $38,000 level.
Are dips limited in BTC?
If Bitcoin fails to rise above the USD 36,500 resistance zone, a downward correction could occur. The immediate downside support is near the USD 36,150 level.
The next major support is near the $35,800 zone or trendline. If there is a move below $35,800, there is a risk of more downside. In the mentioned case, the price could fall towards the key support at USD 35,000 in the short term.
Technical indicators:
Hourly MACD – The MACD is now gaining speed in the bullish zone.
Hourly RSI (Relative Strength Index) – The RSI for BTC/USD is now above the 50 level.
Major support levels – USD 36,150, followed by USD 35,800.
Major resistance levels – $36,500, $37,000 and $37,500.