

Bitcoin price is slowly rising above USD 26,000. BTC is showing signs of a recovery, but it is still struggling to break the USD 26,500 resistance zone.
- Bitcoin is up 2% and it is trading above the USD 26,000 resistance zone.
- The price is trading well above $26,000 and the 100 hourly Simple Moving Average.
- There was a break above a key bearish trendline with resistance near USD 25,940 on the BTC/USD pair hourly chart (Kraken data feed).
- The pair might struggle to break the USD 26,500 and USD 26,750 resistance levels.
Bitcoin Price Avoids Break Down
Bitcoin price managed to stay above the USD 25,350 support zone. BTC bulls protected a major downside break and pushed the price above the USD 25,850 resistance.
There was a move above the USD 26,000 resistance zone. In addition, there was a break above a key bearish trendline with resistance near $25,940 on the hourly chart of the BTC/USD pair. The pair even climbed towards the $26,500 resistance zone where the bears appeared.
A high is forming near USD 26,487 and the price is now consolidating gains. It traded below the 23.6% Fib retracement level from its recent rise from the $25,609 swing low to the $26,487 high.
Bitcoin is now trading well above $26,000 and the 100 hourly Simple Moving Average. The immediate resistance on the upside is near the USD 26,400 level. The first major resistance is near the USD 26,500 level. A good close above the USD 26,500 level could signal a decent increase.
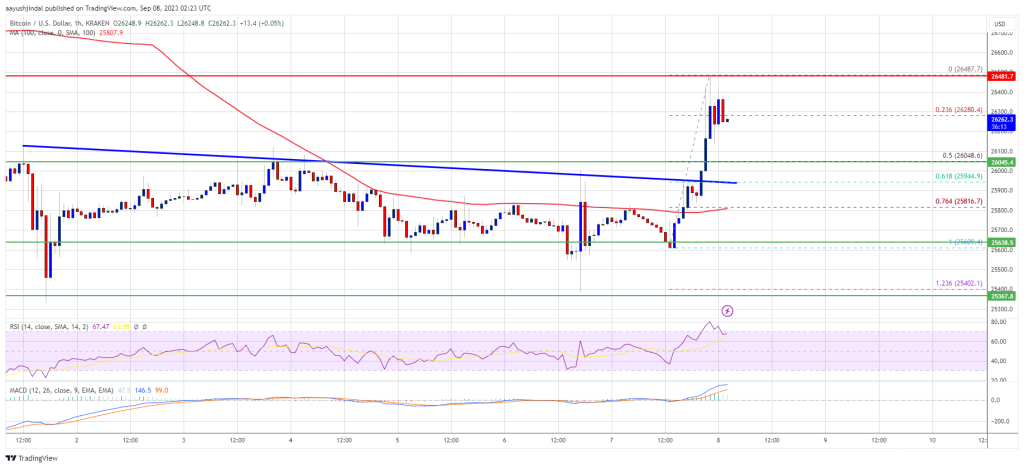
Source: BTCUSD at TradingView.com
The next major resistance is around $27,000, above which the bulls could gain momentum. In the case mentioned, the price could test the USD 28,000 level.
Are the dips now limited in BTC?
If Bitcoin fails to clear the USD 26,500 resistance, a downside correction could take place. The immediate downside support is near the USD 26,100 level.
The next major support is near the $26,000 level or the 50% Fib retracement level from the recent rise from the $25,609 swing low to the $26,487 high. A downside break and a close below the USD 26,000 level could increase selling pressure. In the said case, the price could drop to USD 25,500 or even USD 25,350.
Technical indicators:
Hourly MACD – The MACD is now losing pace in the bullish zone.
Hourly RSI (Relative Strength Index) – The RSI for BTC/USD is now above the 50 level.
Key Support Levels – $26,100, followed by $26,000.
Key resistance levels – $26,400, $26,500 and $27,000.