

This article is available in Spanish.
Bitcoin prices are consolidating around the $95,000 level. BTC needs to clear the USD 96,500 resistance zone to attempt another upside in the near term.
- Bitcoin holds gains above the $93,500 zone.
- The price is trading below $96,500 and the 100 hourly Simple Moving Average.
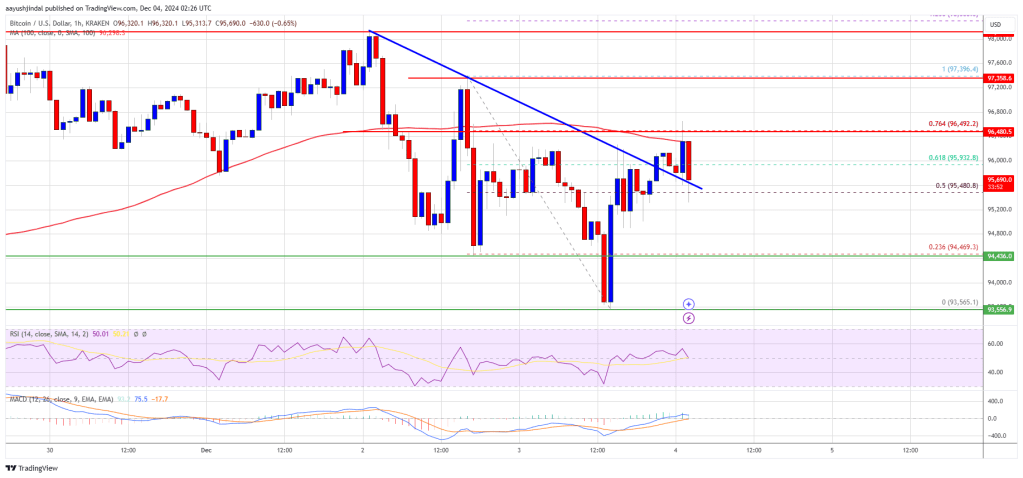
- There was a break above a short-term bearish trendline with resistance at $96,000 on the hourly chart of the BTC/USD pair (data feed from Kraken).
- The pair could gain bullish momentum if it breaks the $96,500 resistance zone.
Bitcoin price faces resistance
Bitcoin price tried to break the USD 96,500 resistance zone. However, the bears remained in action and BTC corrected lower. There was a move below the $94,500 support zone.
The price even peaked below $94,000. A low was formed at $93,565 and the price is now trying to make a new increase. There was quite a move above the USD 95,000 level. The price climbed above the 50% Fib retracement level of the downward move from the $97,395 swing high to the $93,565 low.
There was a break above a short-term bearish trendline with resistance at $96,000 on the hourly chart of the BTC/USD pair. Bitcoin price is now trading below $96,500 and the 100 hourly Simple Moving Average.
On the upside, the price could encounter resistance near the USD 96,500 level. It is close to the 76.4% Fib retracement level of the downward move from the $97,395 swing high to the $93,565 low. The first major resistance is near the $96,800 level. A clear move above the USD 96,800 resistance could push the price higher.
The next major resistance could be at USD 98,000. A close above the USD 98,000 resistance could send the price rising further. In the said case, the price could rise and test the USD 99,000 resistance level. Any further gains could send the price towards the $100,000 level.
Another drop in BTC?
If Bitcoin fails to rise above the USD 96,500 resistance zone, it could trigger another downside correction. The immediate downside support is near the USD 95,500 level.
The first major support is near the $95,000 level. The next support is now near the $93,500 zone. Any further losses could send the price towards the USD 92,000 support in the short term.
Technical indicators:
Hourly MACD – The MACD is now losing pace in the bullish zone.
Hourly RSI (Relative Strength Index) – The RSI for BTC/USD is now below the 50 level.
Major support levels – USD 95,500, followed by USD 93,500.
Major resistance levels – $96,500 and $98,000.