

Bitcoin price consolidates gains above $113,500. BTC could rise further if there is a clear move above the USD 115,750 resistance.
- Bitcoin started a new upward move above the $114,000 resistance level.
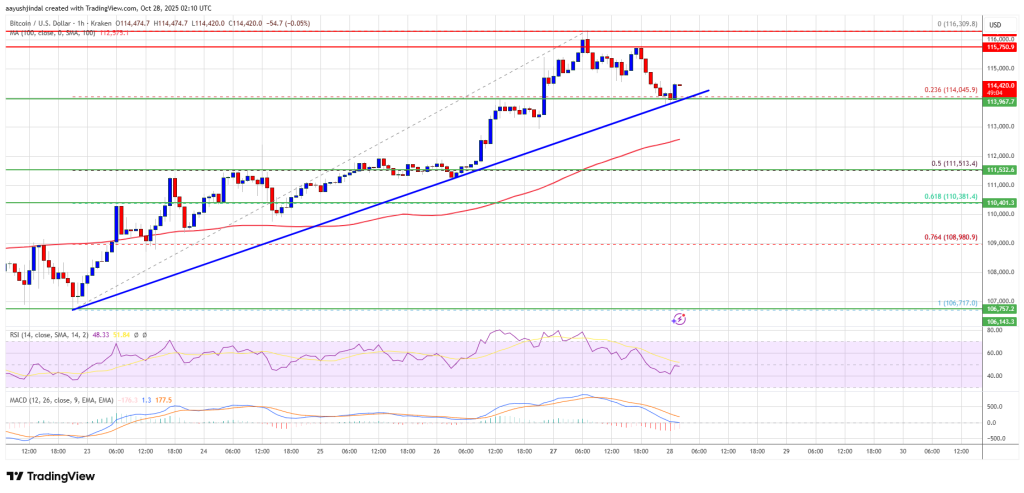
- The price is trading above USD 114,200 and the 100 hourly Simple Moving Average.
- A bullish trendline is forming with support at $113,900 on the hourly chart of the BTC/USD pair (data feed from Kraken).
- The pair could continue to rise if it trades above the $115,750 zone.
Bitcoin Price Begins Consolidation
Bitcoin price formed a base and started a new increase above the $112,500 zone. BTC gained pace and moved above the main hurdle at $113,500.
It opened the doors for a move above $115,000 and the 100 hourly Simple Moving Average. Finally, the price spiked above $116,000 and is currently consolidating gains above the 23.6% Fib retracement level from the recent wave from the $106,718 swing low to the $116,309 high.
Moreover, a bullish trendline is forming with support at $113,900 on the hourly chart of the BTC/USD pair. Bitcoin is now trading above $114,000 and the 100 hourly Simple Moving Average.
The immediate resistance on the upside is near the USD 115,000 level. The first major resistance is around the $115,500 level. The next resistance could be $115,750. A close above the resistance at $115,750 could send the price higher. In the mentioned case, the price could rise and test the USD 116,300 resistance. Any further gains could send the price towards the USD 117,500 level. The next barrier for the bulls could be $118,000.
Another BTC pullback?
If Bitcoin fails to rise above the USD 115,500 resistance zone, it could start a new decline. Immediate support is near the $114,000 level. The first major support is near the $113,500 level or trendline.
The next support is now near the $111,000 zone. Any further losses could send the price towards the USD 110,500 support in the near term. The key support is at $108,500, below which BTC could struggle to recover in the near term.
Technical indicators:
Hourly MACD – The MACD is now gaining speed in the bullish zone.
Hourly RSI (Relative Strength Index) – The RSI for BTC/USD is now above the 50 level.
Major support levels – $114,000, followed by $113,500.
Major resistance levels – $115,500 and $116,500.