Close Menu
  • News
    • Bitcoin
    • Altcoins
    • DeFi
    • Market Cap
  • Blockchain
  • Web 3
    • NFT
    • Metaverse
  • Regulation
  • Analysis
  • Learn
  • Blog
What's Hot

A groundbreaking leap into the consumer future of decentralized AI

2026-03-07

Bitcoin sees historic death cross on three-day chart – what does it mean?

2026-03-07

Bitcoin On-Chain Data Identifies Unusual Market Cap Behavior

2026-03-07
Facebook X (Twitter) Instagram
  • Contact
  • Terms & Conditions
  • Privacy Policy
  • DMCA
  • Advertise
Facebook X (Twitter) Instagram
Bitcoin Platform – Bitcoin | Altcoins | Blockchain | News Stories Updated Daily
  • News
    • Bitcoin
    • Altcoins
    • DeFi
    • Market Cap
  • Blockchain

    A groundbreaking leap into the consumer future of decentralized AI

    2026-03-07

    BitGo to Power SoFiUSD Stablecoin Infrastructure as SoFi Launches First Nationally Chartered Bank Token

    2026-03-07

    AINFT extends multi-chain AI services with BNB chain integration

    2026-03-07

    CMC Markets Begins 24/7 Blockchain Settlements with JP Morgan’s Kinexys

    2026-03-07

    Chainlink helped Visa, ANZ and Fidelity do what banks have been trying to do for years

    2026-03-06
  • Web 3
    • NFT
    • Metaverse
  • Regulation

    US lawmakers consider ban on prediction markets amid bets on Iran

    2026-03-06

    De volatiliteit van Bitcoin zou in april kunnen exploderen als SEC de markt achter de ETF-leverage beoordeelt

    2026-03-06

    Crypto company Kraken secures a direct link to Federal Reserve payments

    2026-03-04

    Bitcoin’s $85 billion derivatives engine may move onshore as CFTC eyes April approval

    2026-03-04

    De deadline voor stablecoins van het Witte Huis verstrijkt terwijl de CLARITY Act vastloopt

    2026-03-03
  • Analysis

    Billionaire Peter Thiel dumps a $74,400,000 stake in three assets, including one of Warren Buffett’s favorites

    2026-03-07

    Bitcoin Price Rally Slows, Consolidation Signals Possible Next Step

    2026-03-07

    XRP Price Ladder Shows What Conditions Are Needed for $18, $100, and $500

    2026-03-07

    Bitcoin’s rally from $73,000 faces a crucial test as momentum looks to change

    2026-03-06

    ‘Good Times Have Arrived’ – Trader Michaël van de Poppe Says the Bitcoin Bear Phase is Over – Here Are His Goals

    2026-03-06
  • Learn

    What Is Wrapped ETH (WETH) and Why Do You Need It in DeFi?

    2026-03-06

    What Is Crypto Protocol and Why Coins Need It

    2026-03-04

    Wat is Liquid Proof-of-Stake: uitgelegd voor beginners

    2026-03-02

    The 9 Most Common Crypto Scam Types

    2026-03-02

    Sidechains Explained: What They Are, How They Work, and Why They Matter

    2026-02-20
  • Blog
Bitcoin Platform – Bitcoin | Altcoins | Blockchain | News Stories Updated Daily
Home»Bitcoin»Bitcoin is showing a bullish Adam and Eve double bottom
Bitcoin

Bitcoin is showing a bullish Adam and Eve double bottom

2024-04-17No Comments3 Mins Read
Share
Facebook Twitter LinkedIn Pinterest Email

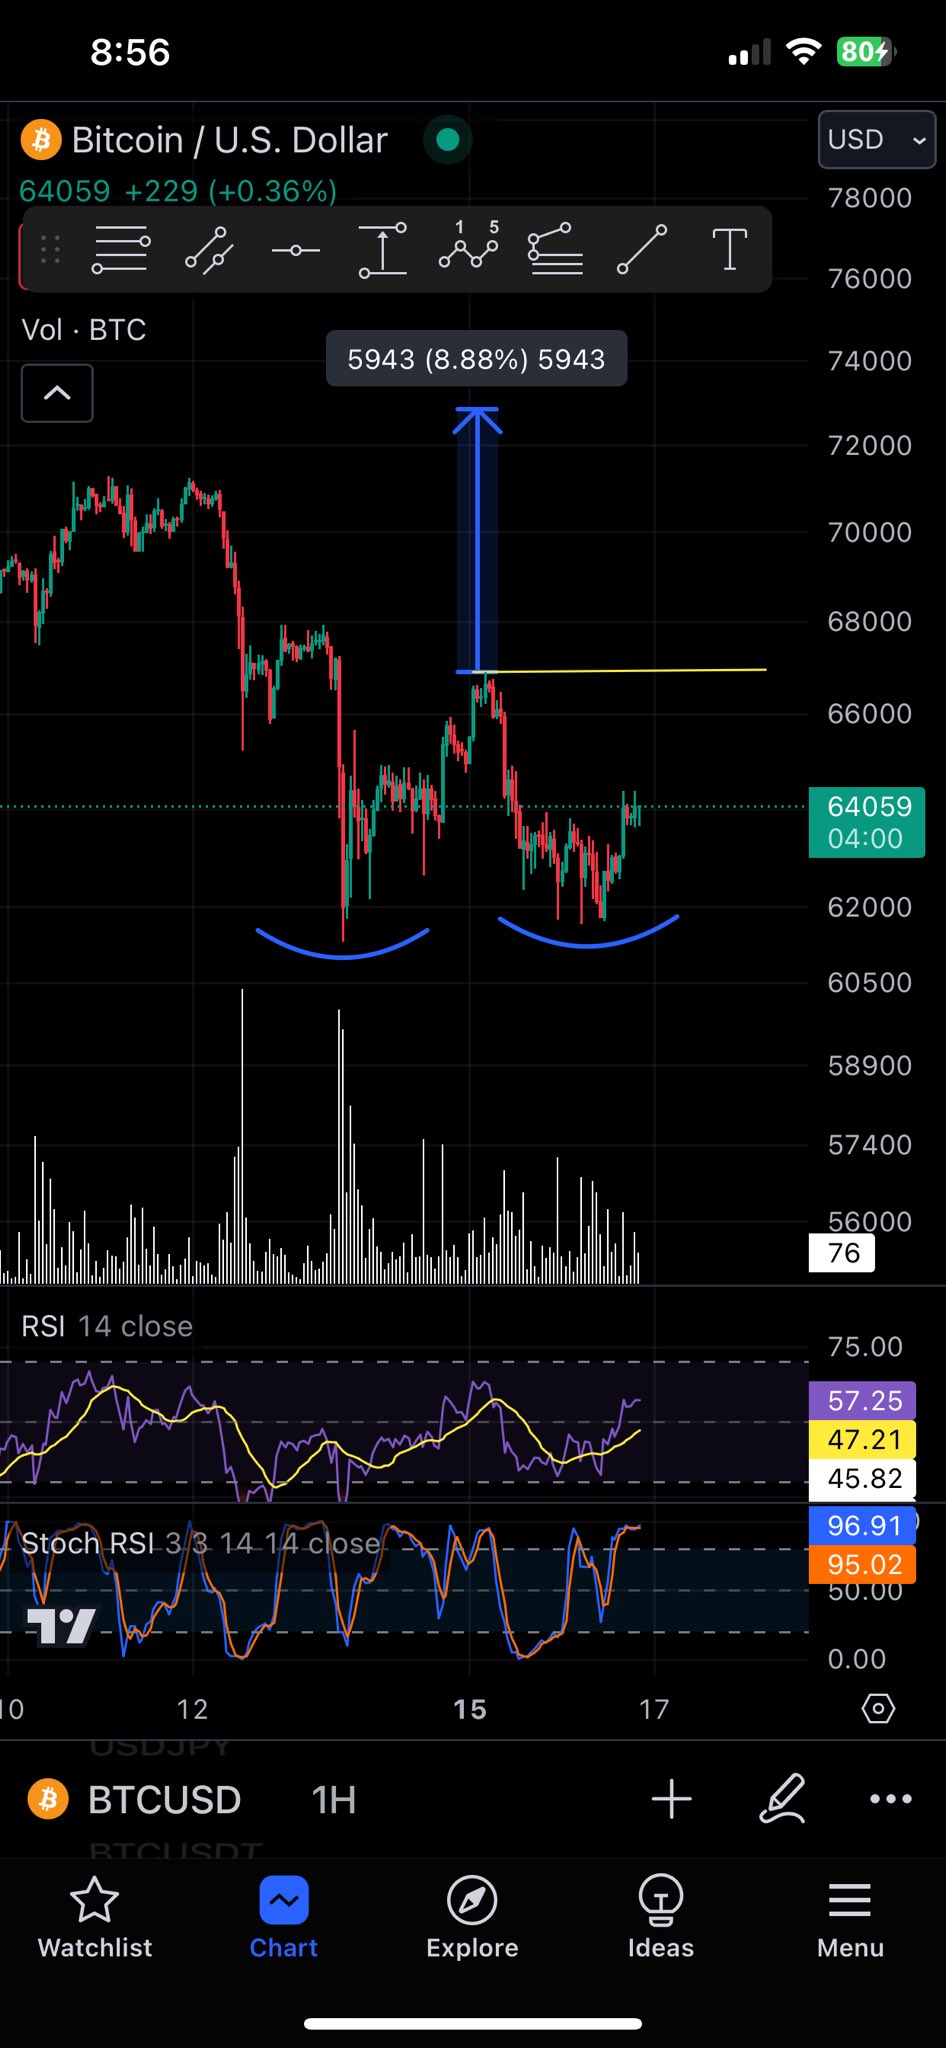
In his latest technical analysis, Christopher Inks, a recognized figure in the field of crypto analysis, points out the possible formation of a bullish Adam and Eve double bottom pattern for Bitcoin. This formation can be seen on the BTC/USD 1-hour chart and has significant implications for the cryptocurrency’s price action in the short term.

The chart depicts Bitcoin’s price movement with a clear pattern that resembles two troughs with a peak in between. The first low, known as the ‘Adam’, is characterized by a sharp, V-shaped bottom, indicating a rapid price drop and an equally rapid recovery. This is followed by a more rounded, gradual and broader ‘Eve’ trough, indicating a slower and more deliberate price recovery.

Bitcoin possible Adam and Eve double bottom in progress
Bitcoin possible double bottom Adam and Eve in progress | Source: @TXWestCapital

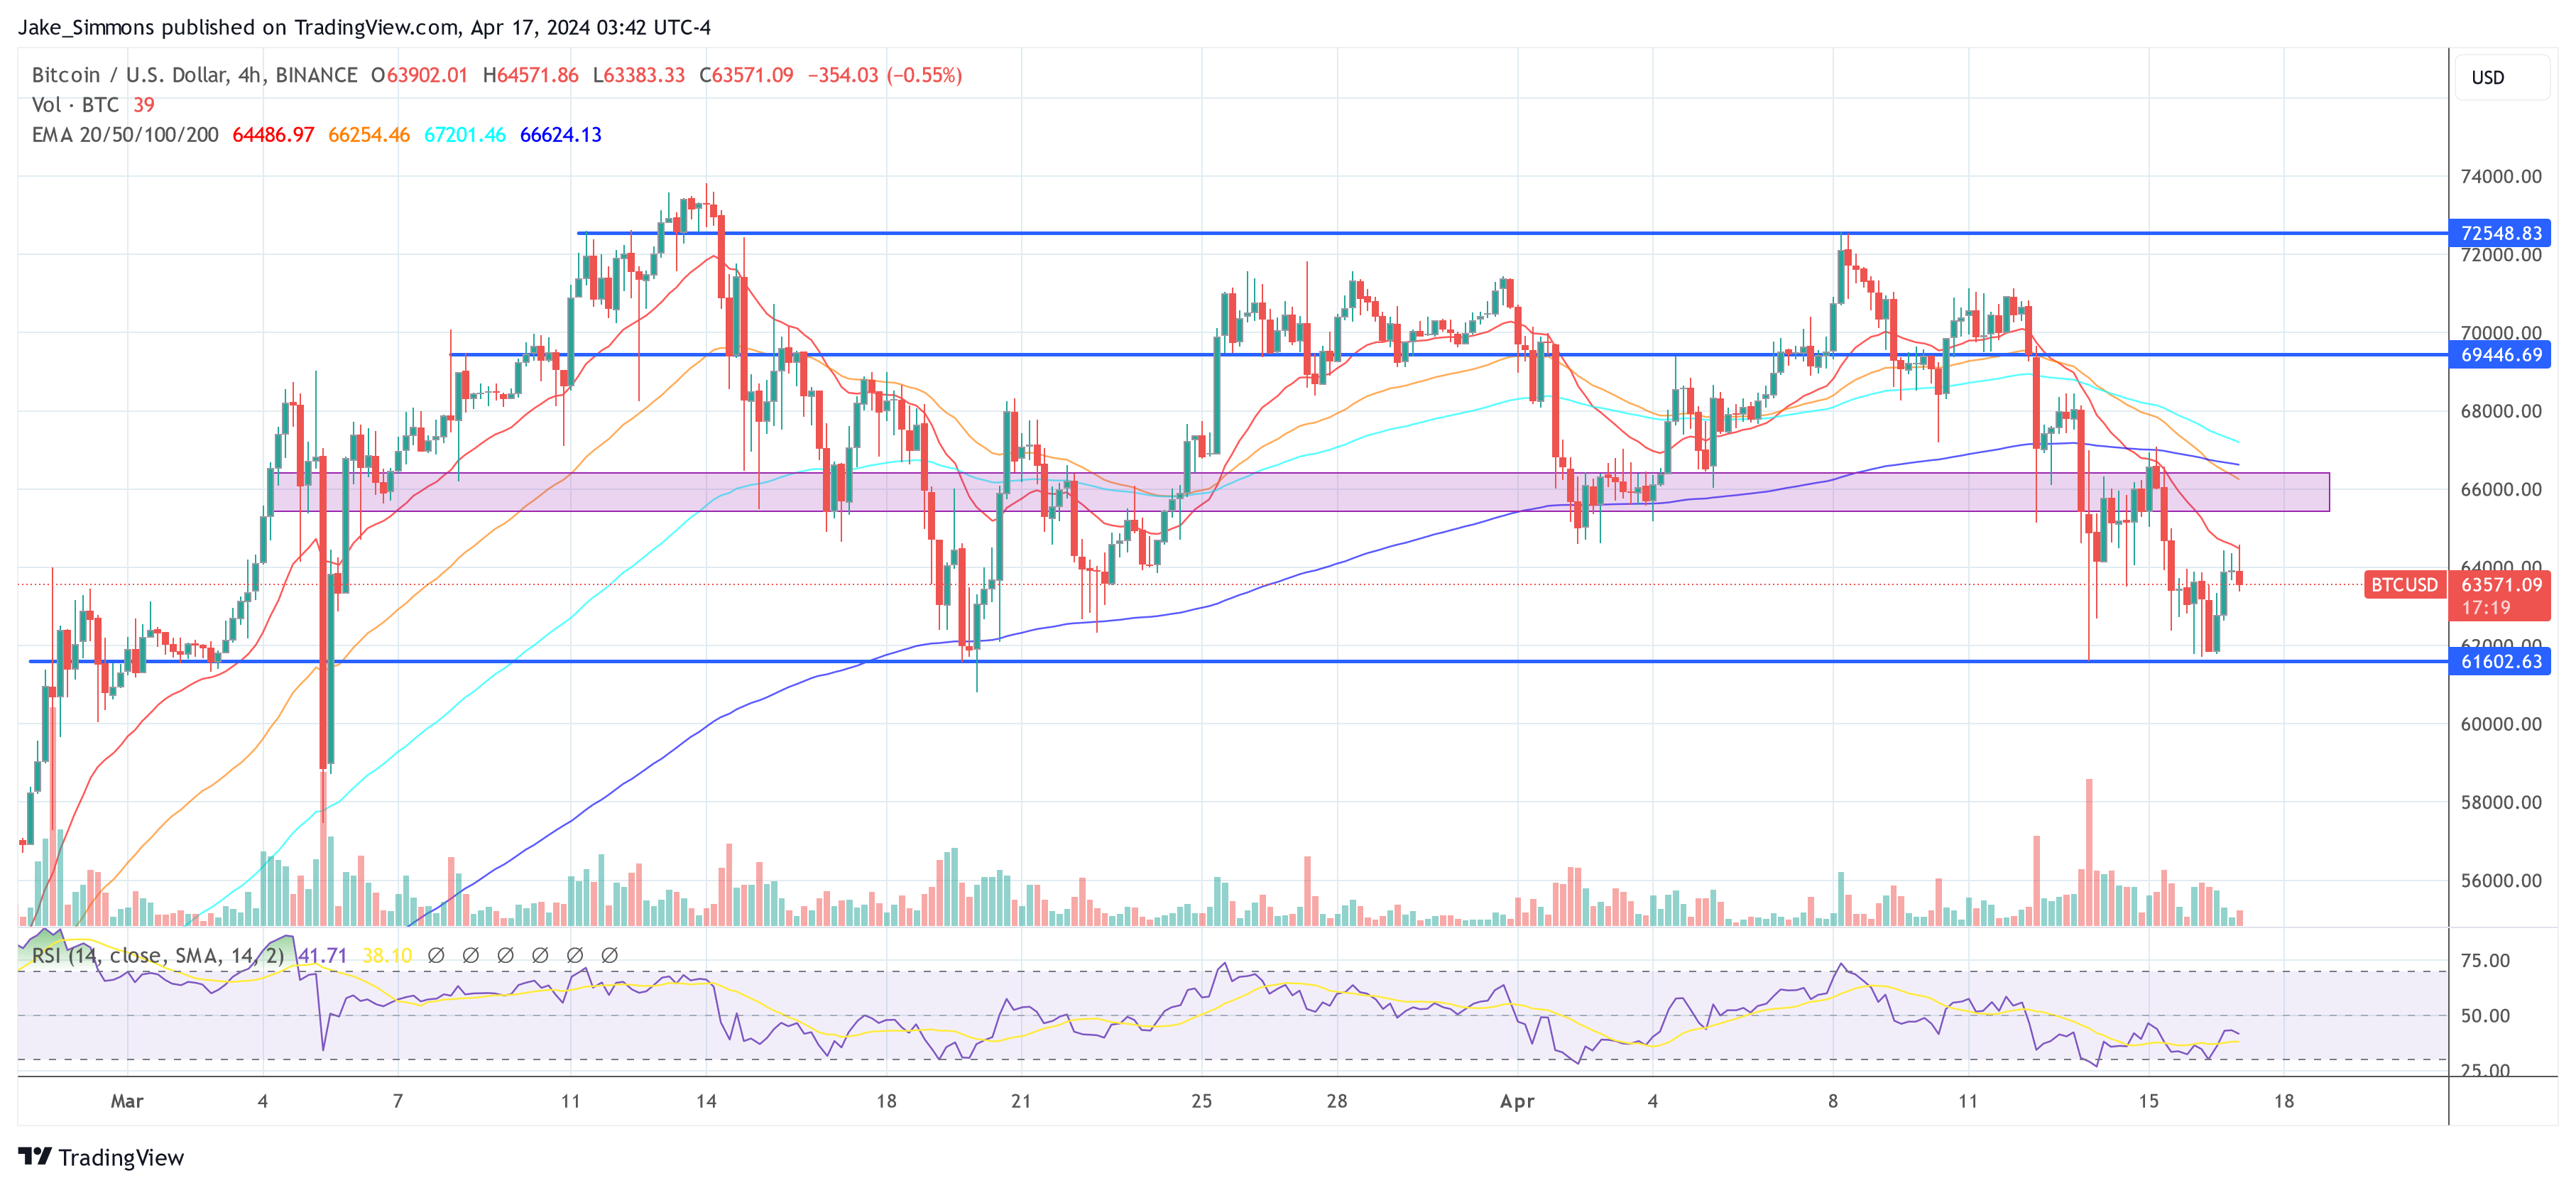
Bitcoin is aiming for its all-time high

In this analysis, the price level is marked by a horizontal yellow line, which Inks suggests is the neckline of the pattern. A break and close above this neckline would confirm the pattern, signaling a possible bullish reversal. The importance of this neckline, which is around the $67,000 price level, cannot be overstated as it represents a key resistance point that the price must surpass to confirm the pattern.

To infer the purpose of the pattern, Inks uses the depth of the formation, measured from the neckline to the lowest point of the Adam Trough. This high (8.88%) is then projected upwards from the breakout point, suggesting the pattern target would be near $73,000, close to Bitcoin’s all-time high (ATH).

Other technical indicators on the chart include volume, the Relative Strength Index (RSI), and the Stochastic RSI. The volume, indicated at the bottom of the graph, has shown a significant peak during the formation of the Adam bottom, followed by a less pronounced volume during the formation of the Eve. This volume profile is often accompanied by the Adam and Eve pattern and can serve as a confirming signal of bullish sentiment.

See also  “Happy anniversary, Bitcoin,” says Gary Gensler – sparks outrage

The RSI, a momentum oscillator that measures the speed and change of price movements, is at 47, neutral territory, showing that neither the bulls nor the bears have gained full control. The stochastic RSI, a more sensitive indicator that combines the characteristics of stochastic oscillators and RSI, indicates strong upward momentum, with a value above 95 out of 100, which could indicate a possible short-term pullback due to overbought conditions.

Finally, it is important to note that the Stochastic RSI shows a crossover in the overbought area, which can sometimes precede a price correction. However, given the bullish pattern indicated by the Adam and Eve formation, sentiment appears to be leaning toward an optimistic outlook. If the BTC price breaks above $67,000 and an hourly candle closes above this threshold, the bulls could target the all-time high at $73,780.

At the time of writing, BTC was trading at $63,571.

Bitcoin price
BTC price, 4-hour chart | Source: BTCUSD on TradingView.com

Featured image created with DALL·E, chart from TradingView.com

Disclaimer: The article is for educational purposes only. It does not represent NewsBTC’s views on buying, selling or holding investments and of course investing involves risks. You are advised to conduct your own research before making any investment decisions. Use the information on this website entirely at your own risk.


Source link

Adam Bitcoin Bottom Bullish Double eve showing
Share. Facebook Twitter Pinterest LinkedIn Tumblr Email

Related Posts

Bitcoin sees historic death cross on three-day chart – what does it mean?

2026-03-07

Bitcoin On-Chain Data Identifies Unusual Market Cap Behavior

2026-03-07

Bought 4,277 BTC, is 10K next? How STRC Boosts MSTR’s Bitcoin Moves!

2026-03-07

Short-Term Profit Taking Pushes Bitcoin Back Below the Key $70,000 Level – What Now?

2026-03-07
Add A Comment

Comments are closed.

Top Posts

Cardano founder urges ADA investors to be wary of new scams

2023-06-05

Trader who has nailed Bitcoin Pre-Ralling correction, sees BTC of all time high parabolic rally-here-it

2025-01-29

The SEC’s $125 million settlement with XRP isn’t a win for them – it’s a big old L

2024-08-09
Editors Picks

Crypto trading platform BitMEX pleads guilty to bank secrecy law violations

2024-07-11

IMF says tax systems need to be updated for crypto assets, decentralized exchanges are part of the problem

2023-07-09

Korean crypto exchanges boost altcoin transactions in January

2024-01-15

Prom integrates Fandom to revolutionize digital culture with NFTs and Web3

2024-05-26

Our mission is to develop a community of people who try to make financially sound decisions. The website strives to educate individuals in making wise choices about Cryptocurrencies, Defi, NFT, Metaverse and more.

We're social. Connect with us:

Facebook X (Twitter) Instagram Pinterest YouTube
Top Insights

A groundbreaking leap into the consumer future of decentralized AI

Bitcoin sees historic death cross on three-day chart – what does it mean?

Bitcoin On-Chain Data Identifies Unusual Market Cap Behavior

Get Informed

Subscribe to Updates

Get the latest news and Update from Bitcoin Platform about Crypto, Metaverse, NFT and more.

  • Contact
  • Terms & Conditions
  • Privacy Policy
  • DMCA
  • Advertise
© 2026 Bitcoinplatform.com - All rights reserved.

Type above and press Enter to search. Press Esc to cancel.