

Bitcoin price started a new rise above $92,500. BTC is now consolidating gains and could attempt an upside break above $93,500.
- Bitcoin started a new rise above the $92,500 zone.
- The price is trading above $92,000 and the 100 hourly Simple Moving Average.
- There was a break below a bullish trendline with support at $93,000 on the hourly chart of the BTC/USD pair (data feed from Kraken).
- The pair could continue to rise if it breaks above the $93,000 zone.
Bitcoin price faces resistance
Bitcoin price managed to stay above the $90,000 zone and started a new increase. BTC gained strength for a move above the USD 90,500 and USD 91,500 levels.
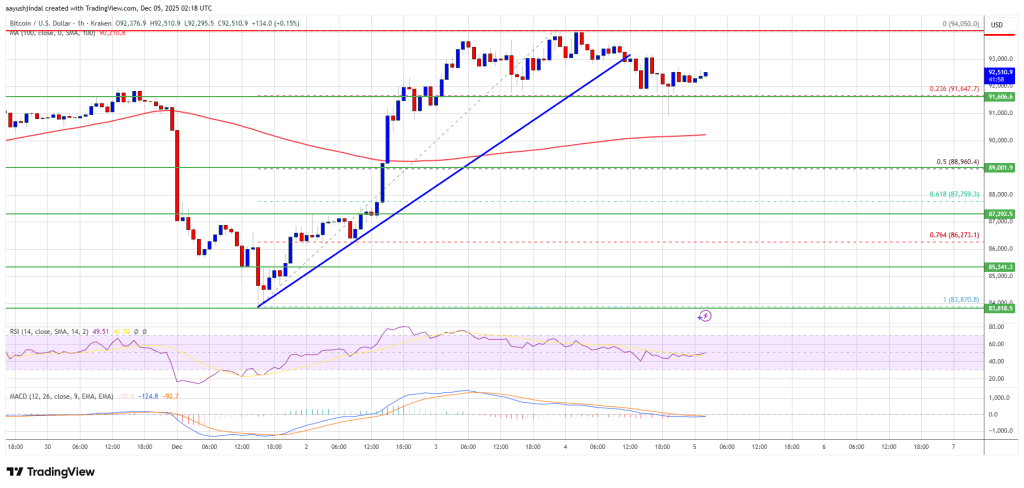
There was a clear move above the USD 93,000 resistance. It reached a high at $94,050 and the price is now consolidating gains. There was a small decline that tested the 23.6% Fib retracement level of the upward move from the $83,870 swing low to the $94,050 high.
There was a break below a bullish trendline with support at $93,000 on the hourly chart of the BTC/USD pair. Bitcoin is now trading above $92,000 and the 100 hourly Simple Moving Average.
If the bulls remain in action, the price may try to rise again. The immediate resistance is near the $92,800 level. The first major resistance is around the $93,000 level. The next resistance could be $94,000. A close above the USD 94,000 resistance could send the price rising further. In the mentioned case, the price could rise and test the USD 95,000 resistance. Any further gains could send the price towards the USD 95,500 level. The next threshold for the bulls could be $96,200 and $96,450.
Disadvantage of BTC?
If Bitcoin fails to rise above the USD 94,000 resistance zone, it could trigger another decline. The immediate support is near the $91,650 level. The first major support is near the $90,500 level.
The next support now lies near the $88,950 zone or the 50% Fib retracement level of the upward move from the $83,870 swing low to the $94,050 high. Any further losses could send the price towards the USD 87,750 support in the short term. The key support is at $87,200, below which BTC could potentially accelerate lower in the near term.
Technical indicators:
Hourly MACD – The MACD is now losing pace in the bullish zone.
Hourly RSI (Relative Strength Index) – The RSI for BTC/USD is now below the 50 level.
Major support levels – USD 91,650, followed by USD 90,500.
Major resistance levels – $93,000 and $94,000.