

Bitcoin is printing losses on the chain on a scale last seen during the Luna/UST meltdown, but at a radically different price level, a distinction that changes what the signal likely means for this pullback.
Axel Adler Jr. said Bitcoin’s net realized gain/loss has sunk deep into negative territory, with the seven-day moving average falling to -$1.99 billion on February 7, before improving slightly to -$1.73 billion on February 10. That puts the current regime among the most severe loss-dominant trajectories ever. Adler described it as “the second deepest negative reading in the entire history of observations,” which was not exceeded until June 18, 2022, when the benchmark reached -$2.24 billion amid the Luna/UST crash and successive liquidations.
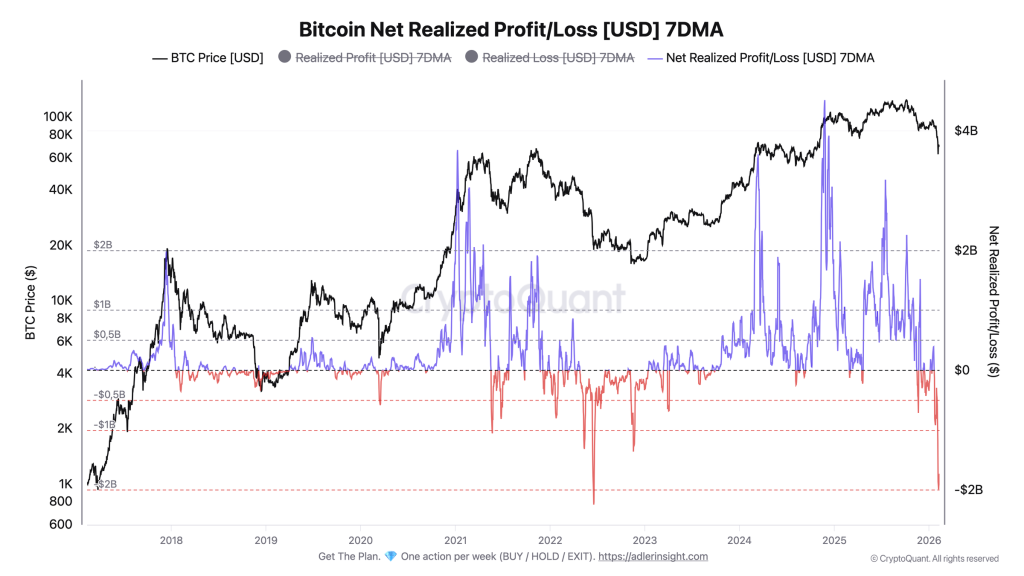
The most important detail, Adler argues, is persistence. Net realized P/L has remained below -$1.7 billion for five consecutive days, which he said represents a persistent cluster of seller pressure, the kind of multi-day compression that marks typical capitulation behavior rather than a single shock.
According to Adler, the mechanism is simple: realized losses dominate realized gains on moved coins, and the market operates through the supply owned by participants who are forced or willing to sell below their cost.
Related reading
“The depth and duration of the current negative regime indicate a massive capitulation of participants who bought coins at higher levels,” he wrote. “The key reversal trigger is the return of net realized P/L above zero, which would signal the market’s transition from loss dominance to profit dominance. As long as the metric remains deeply negative, seller pressure remains.”
Bitcoin losses correspond to the Luna Crash scale
The accompanying chart, Bitcoin Realized Loss (7DMA), shows realized losses that reached around $2.3 billion on February 7 and remained near that level through February 10, another rarity in the historical context. Adler called it “one of the highest flattened levels in the entire history of observations,” explicitly comparing it to June 2022.
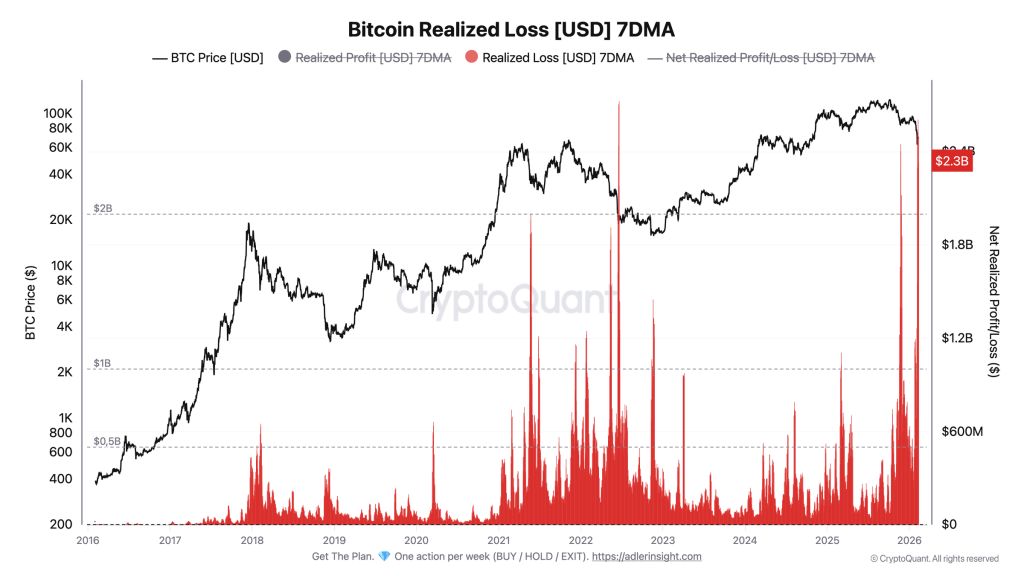
He also emphasized that the seven-day smoothing underestimates peak stress in real time. At the peak of the 2022 episode, Adler noted, single-day losses were about three times higher than the weekly smoothed figure. In the current period, he pointed to a single-day loss of $6.05 billion on February 5, the second-largest single-day loss in Bitcoin history, according to his note.
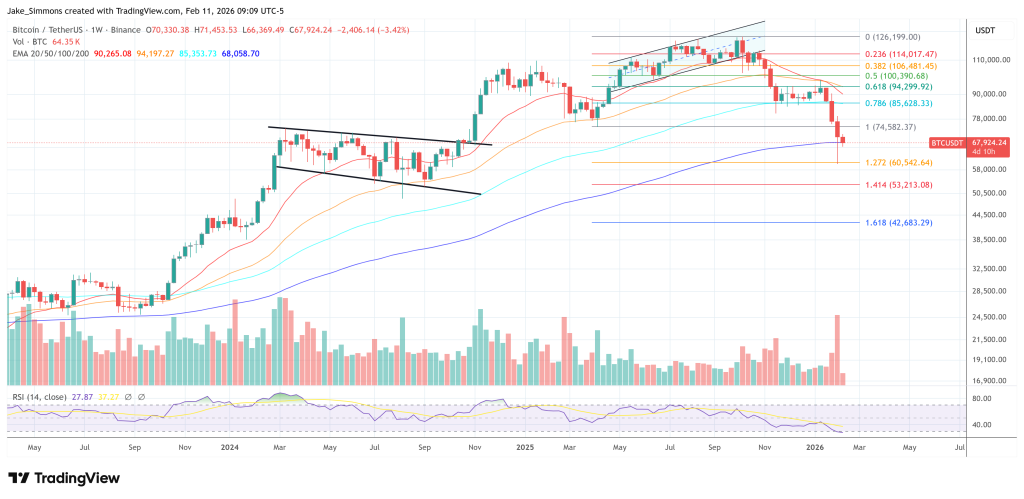
However, the headline comparison is not only about size, but also about context. A similar loss regime occurred in 2022 when bitcoin traded around $19,000. This time, Adler says, the losses are crystallizing around $67,000, after a pullback of $125,000, a context he sees as a correction that washes away late entries rather than a cascade of failures across the ecosystem.
Related reading
“At that time, a realized loss of $2.7 billion occurred at a price of $19,000,” Adler wrote. “Now similar loss volumes are being recorded at a price of $67,000, which does not indicate a system crash, but rather a wash-out of late bull-cycle revenue. This is capitulation by top local buyers, and not a fundamental loss of network value.”
In Adler’s playbook, two markers are placed front and center. The first is a sustained move of the net realized gain/loss (7DMA) back above zero for several weeks, which he considers the transition from loss dominance to gain dominance. The second is a drop in realized loss (7DMA) below $1 billion, which would indicate that the wave of forced or pain-driven selling is fading.
The risk, he says, is that the market’s “purge stress” shifts to something more definitive as price weakness increases. Adler marked the area below $60,000 as a limit where continued growth in realized losses alongside further price declines could turn a correction into a “complete capitulation,” not because the current pressure is small, but because the regime could expand and deepen.
For now, Adler’s core claim is that Bitcoin produces moon-sized loss signals without luna-like structural damage. Same order of magnitude on the chain, different story on the tape.
At the time of writing, BTC was trading at $67,924.
Featured image created with DALL.E, chart from TradingView.com