- Analysts predicted that Bitcoin could repeat the bull run pattern of 2017 and 2021, indicating an impending rise.
- Despite recent dips, 75% of BTC holders remained profitable, with whales holding 12% of the supply.
Bitcoin [BTC] has experienced a notable drop in value over the past 24 hours. Starting at around $60,890, Bitcoin showed brief signs of resilience, with upside momentum early on.
However, it soon faced a sharp decline, falling below the $59,000 threshold.
At the time of writing, Bitcoin was trading at $58,315.93which reflects a decline of 4.21% in the last 24 hours. Despite this, Bitcoin has seen a 1.96% price increase over the past week.
With a circulating supply of 20 million BTC, Bitcoin’s market capitalization was $1.15 trillion.
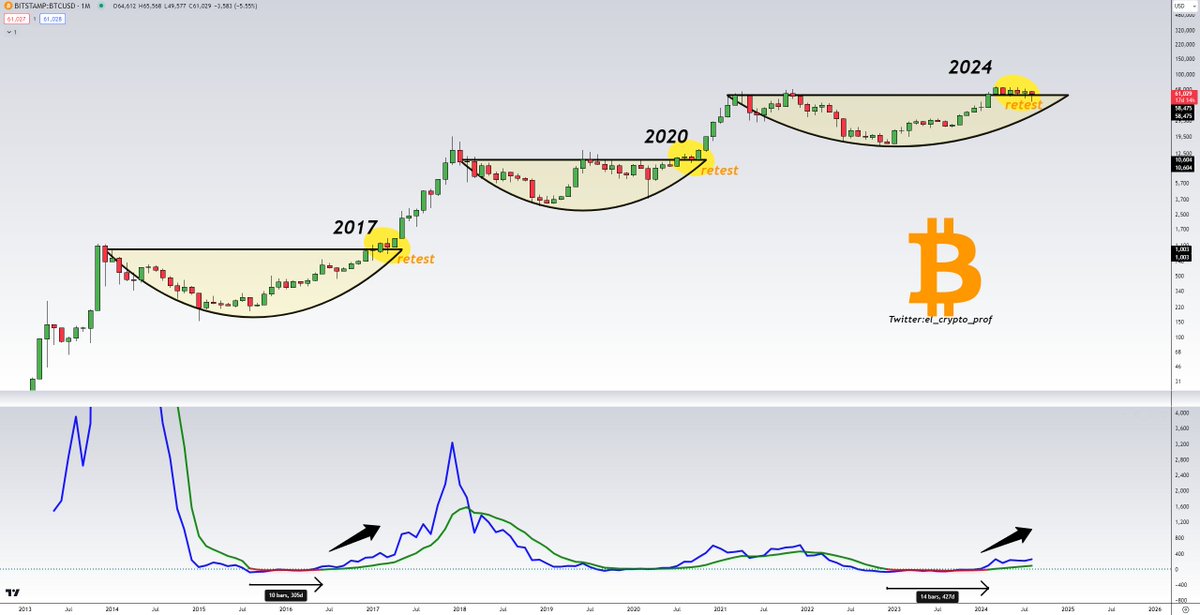
Bitcoin’s recent performance has drawn comparisons to previous bull markets, especially those of 2017 and 2021.
According to analyst Mustache on
Mustache noted,
“If you think the bull market is over, open the charts. BTC does the same thing as in 2017 and 2021, only it is faster in terms of timing. The last time the ROC & SROC indicator changed from red to green was in 2016. There is a huge wave coming.”
The historical pattern in Bitcoin’s price shows recurring bullish cup-and-handle formations that preceded major rallies in 2017 and 2020, while another potential rally is expected in 2024.
These patterns include a ‘retest’ phase, during which the price consolidates before breaking out to new highs.
In fact, this historical trend suggested that Bitcoin could be preparing for another significant upward move as it approaches its next retest in 2024.


Source:
Market sentiment and price support
Despite the recent decline, market sentiment surrounding Bitcoin remained largely optimistic. Mustache added,
“It’s always funny to see the bears come out and post horror scenarios even though BTC is only down 5%. They probably didn’t realize that Bitcoin has been above the 2021 ATH for 7 months. That’s called support. Very, very strong support.”
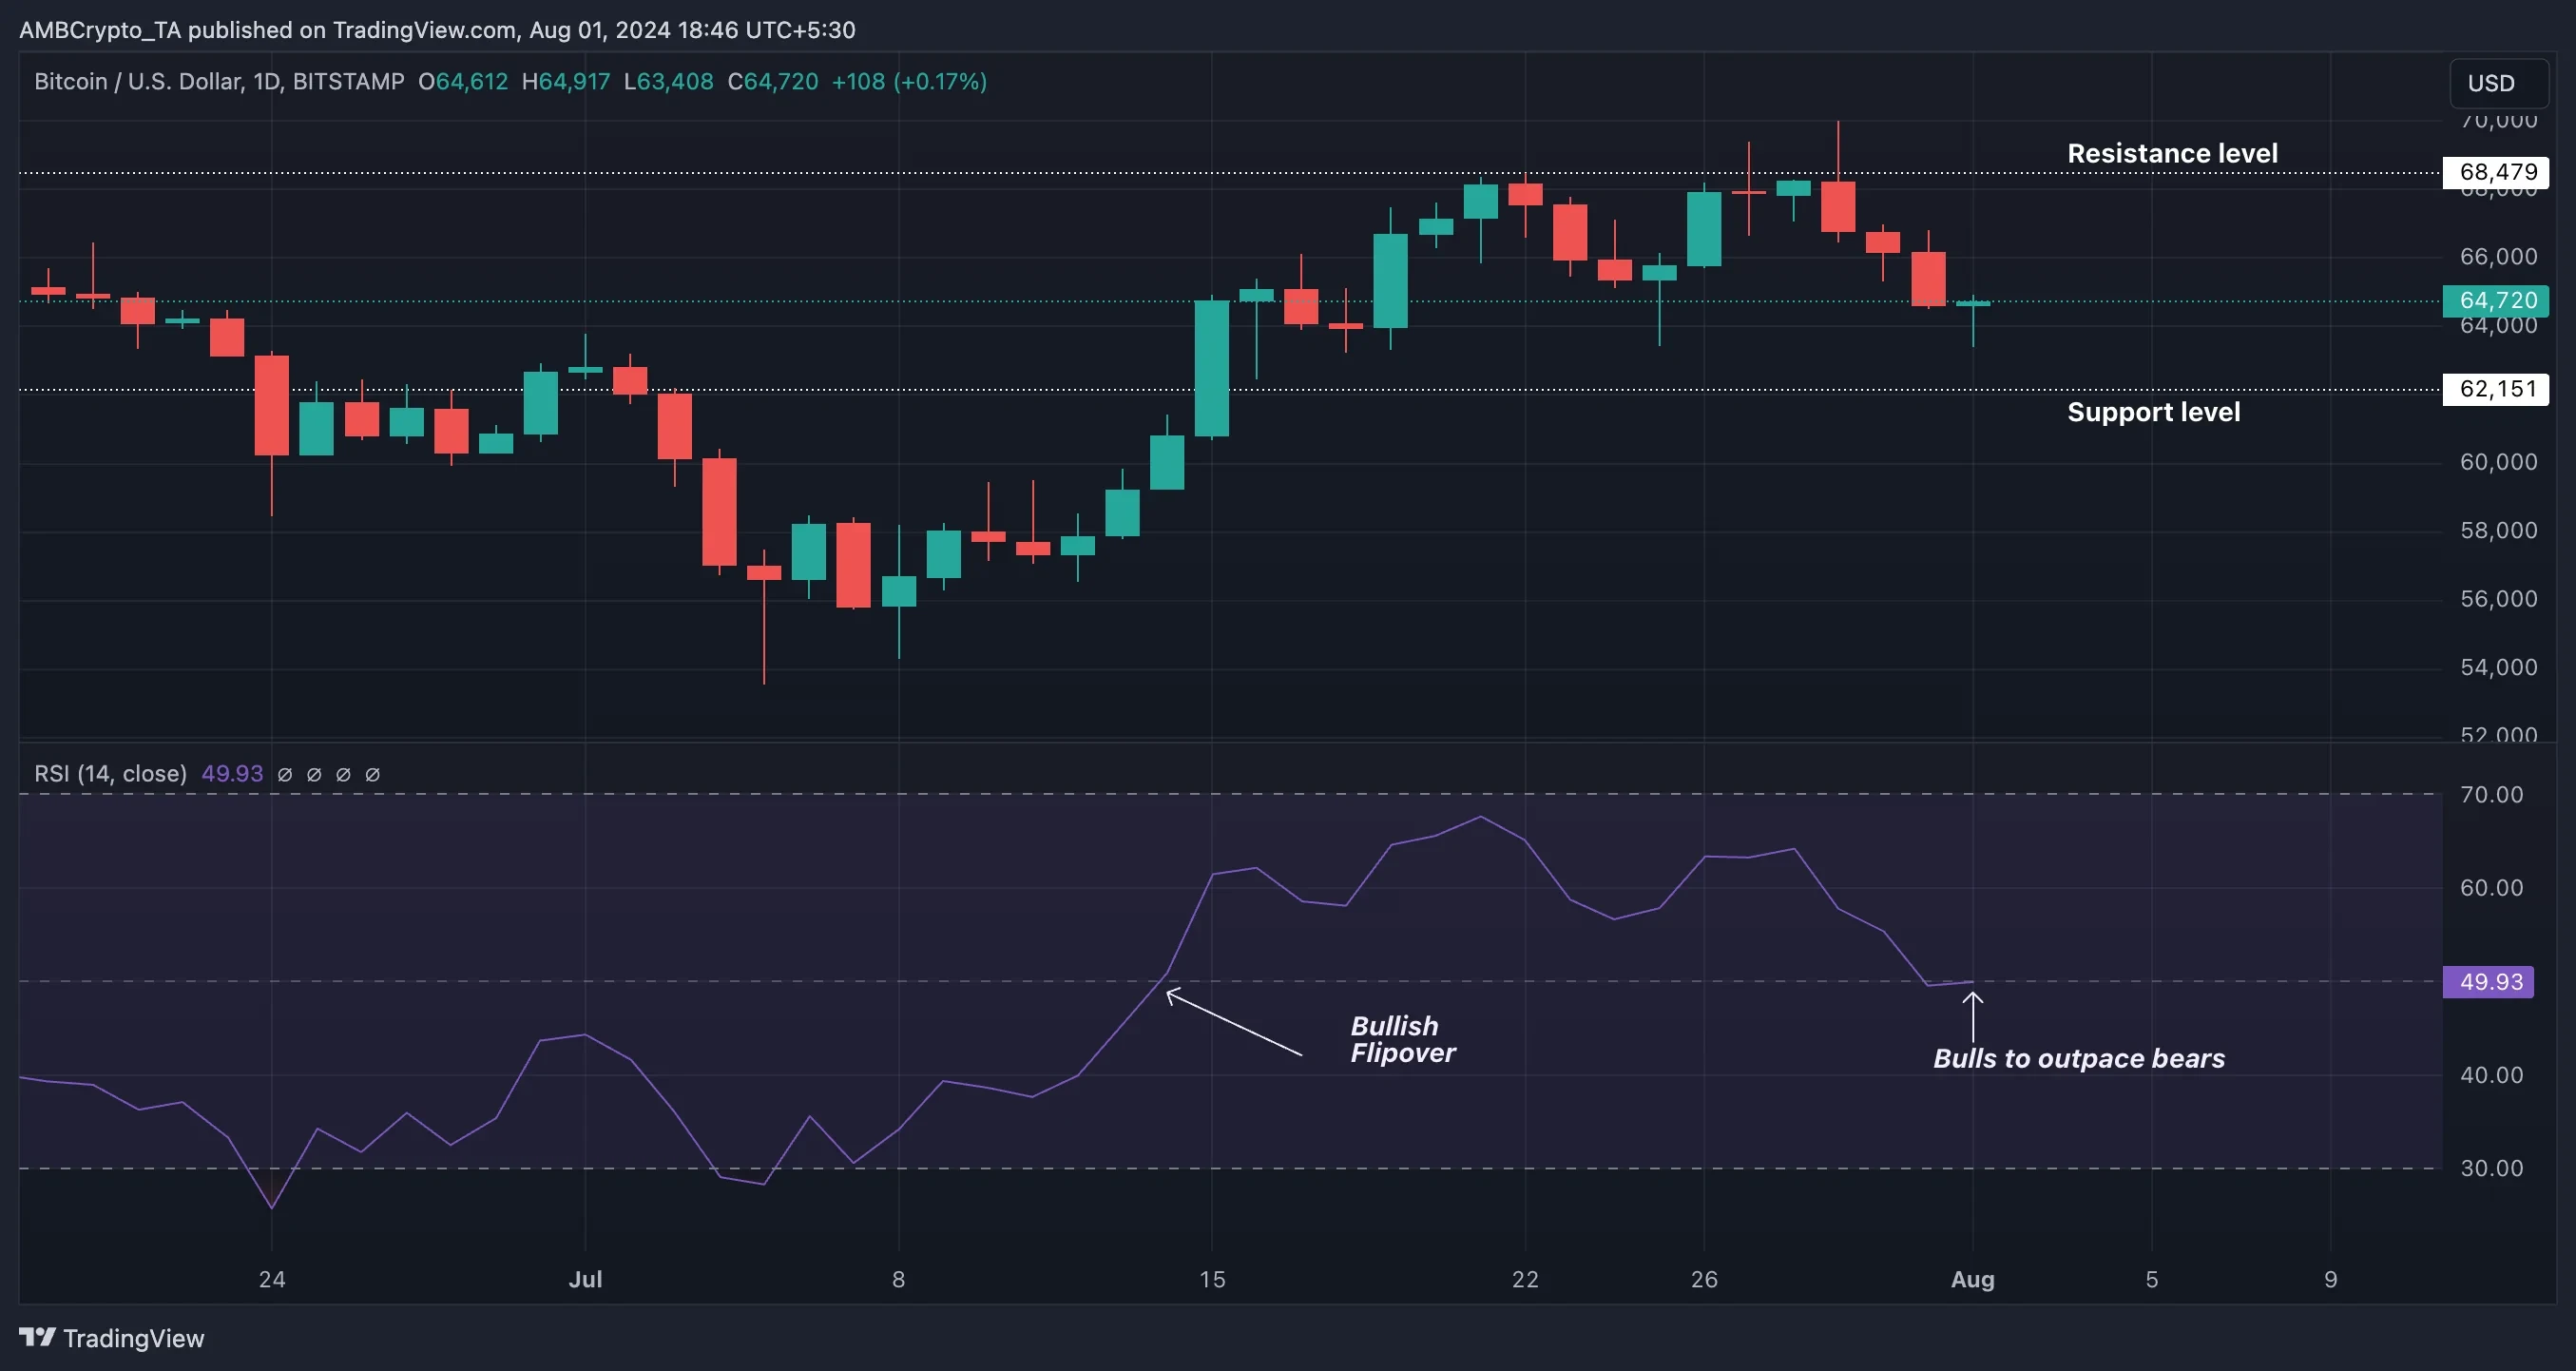
Current technical indicators sent mixed signals. The Bollinger Bands suggested declining volatility as price remained close to the mid-band.
TThe MACD histogram was in the negative zone at the time of writing, indicating bearish momentum, but this momentum appeared to be weakening.
However, the MACD line was approaching a potential bullish crossover, which could signal a reversal in the current trend.
Overall, Bitcoin has been consolidating within certain limits, and a breakout could mark the next big move.


Source: TradingView
Bitcoin summary and market signals
According to InTheBlok Bitcoin’s token summary showed that 75% of holders benefited at the current price. 18% made a loss, while 7% broke even. Whales controlled 12% of the total supply.
In terms of the composition of holders, 71% have owned Bitcoin for more than a year, 24% for 1 to 12 months, and 5% for less than a month.
Over the past seven days, transactions over $100,000 totaled $84.68 billion, with 53% of these transactions coming from the East and 47% from the West.
In addition, total net foreign exchange flows during this period were $418.15 million.


Source: IntoTheBlock
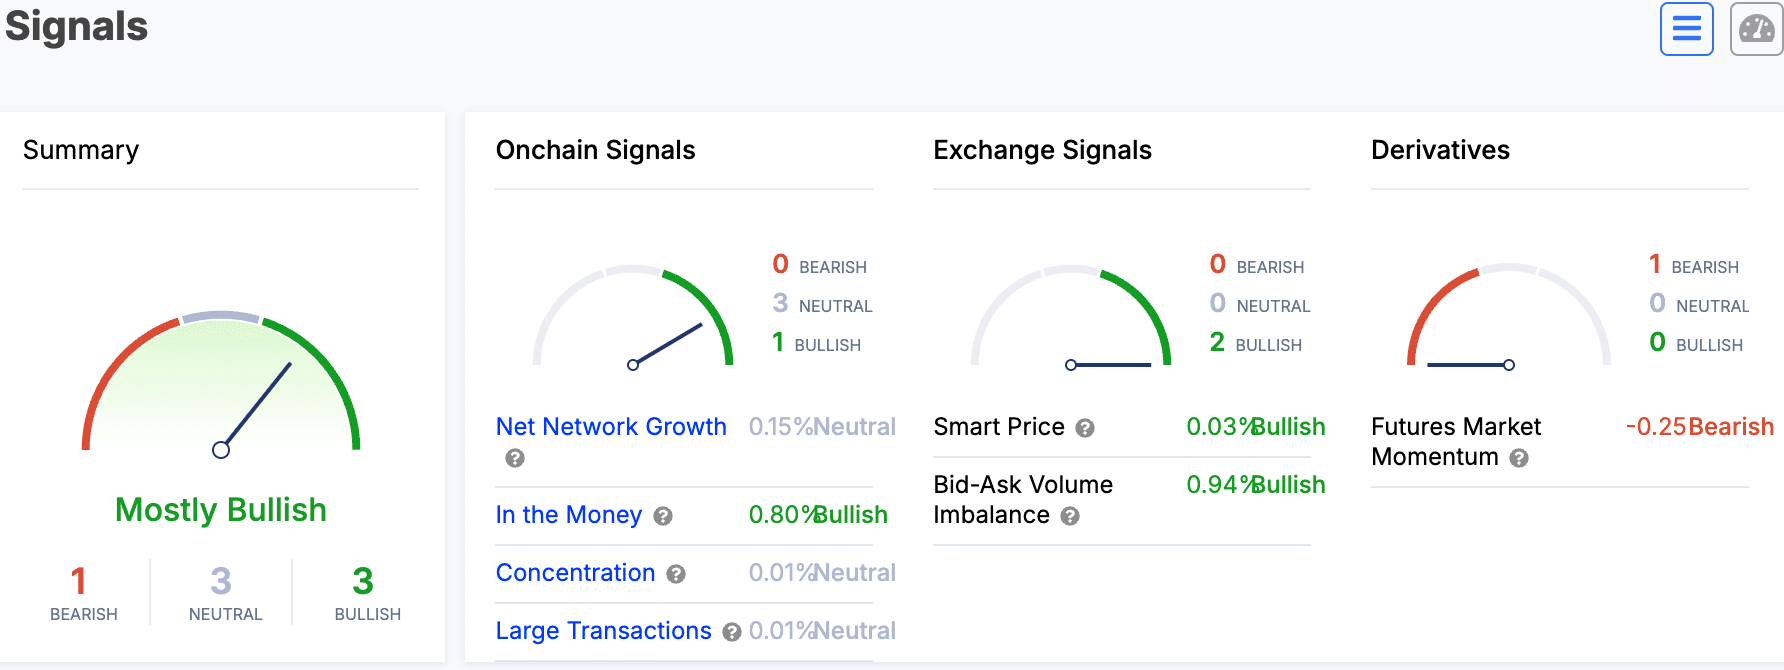
Market signals indicated an overall “largely bullish” sentiment. On-chain signals showed three neutral indicators and one bullish, with a net network growth of 0.15%, categorized as neutral.
Meanwhile, 0.80% of holders were in the money, a bullish indicator. The stock signals were completely bullish, with the smart price up 0.06% and an imbalance between the bid and ask volumes of 2.13%.
However, the derivatives market reflected somewhat bearish sentiment, with futures market momentum at -0.25%.


Source: IntoTheBlock
Is your portfolio green? Check out the BTC profit calculator
According to AMBCrypto’s look at DefiLlama According to data, at the time of writing, Bitcoin had a total value of $620.01 million, with a 24-hour volume of $201,892 and 662,757 active addresses.
This analysis suggested that despite short-term fluctuations, Bitcoin may be gearing up for another significant upward move, reminiscent of previous bull markets.


