- Data shows that BTC “shrimp” – wallets holding more than one Bitcoin – have consistently accumulated holdings over time and now control a significant portion of the supply.
- BTC’s price trajectory also reflects the 2017 rally cycle, during which the asset saw significant upward momentum.
Over the past 24 hours, the market has shown signs of recovery, with that of Bitcoin [BTC] The market capitalization increased by 1.44% to $1.88 trillion, accompanied by a notable increase in trading volume of 144.37%.
This recent move has limited BTC’s losses to a 6% drawdown range over the past week and month.
Historical patterns indicate that BTC remains positioned for potential upside as investors continue to steadily accumulate the assets.
BTC investors are paving the way for further growth
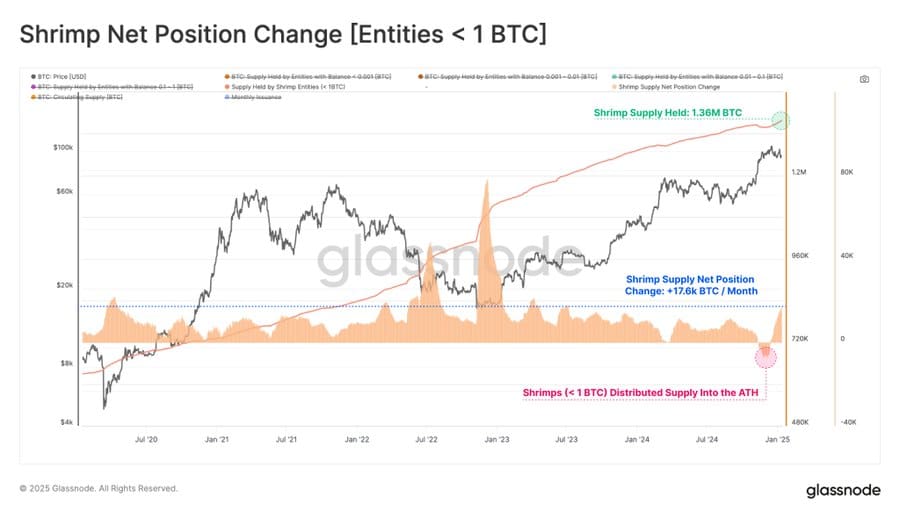
According to data from Glassnode, after a period of heavy distribution – marked by significant BTC selling as the asset neared its all-time high of $108,353 – BTC shrimp accumulations have resumed.
In this context, “shrimp” refers to wallet addresses that contain more than one BTC.
The data shows that this cohort significantly increased their holdings, with an average of 17,600 BTC per month. This brings their total share to 6.9% of the circulating BTC supply.


Source: Glassnode
This accumulation trend signals a potentially bullish outlook for the market as investors continue to build their positions despite recent volatility.
Closer analysis suggests that the recent shakeout could be part of a broader setup for an impending bull run, very similar to the 2017 rally.
BTC mirrors the 2017 rally with similar market movements
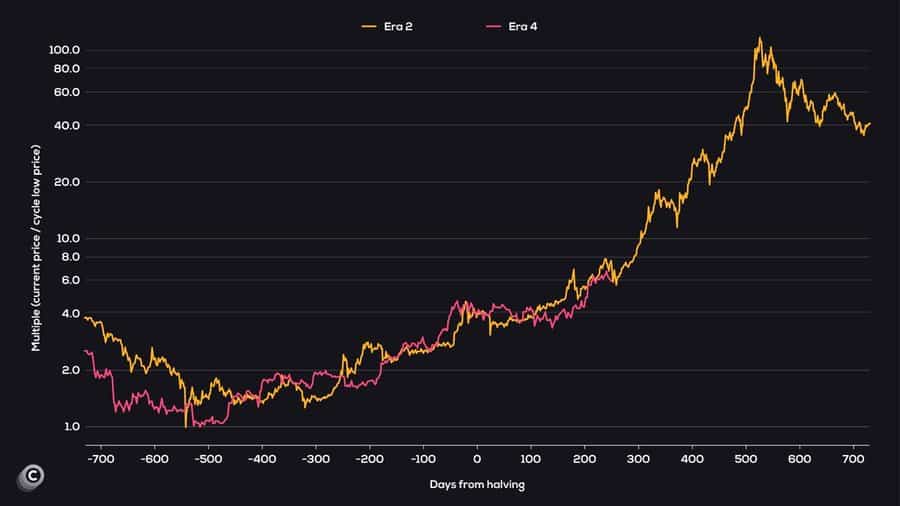
Recent data suggests that Bitcoin’s current market cycle is closely following the trajectory of the 2017 bull run.
The analysis tracks BTC’s price movement during the post-halving periods – a phase where miner rewards are reduced.


Source:
This comparison shows that BTC has consistently followed a similar pattern. If this trend continues, BTC could significantly surpass its current All-Time High (ATH).
While the overall trajectory is in line with 2017, there have been occasional divergences in price movement.
Continued buying activity indicates bullish momentum for BTC
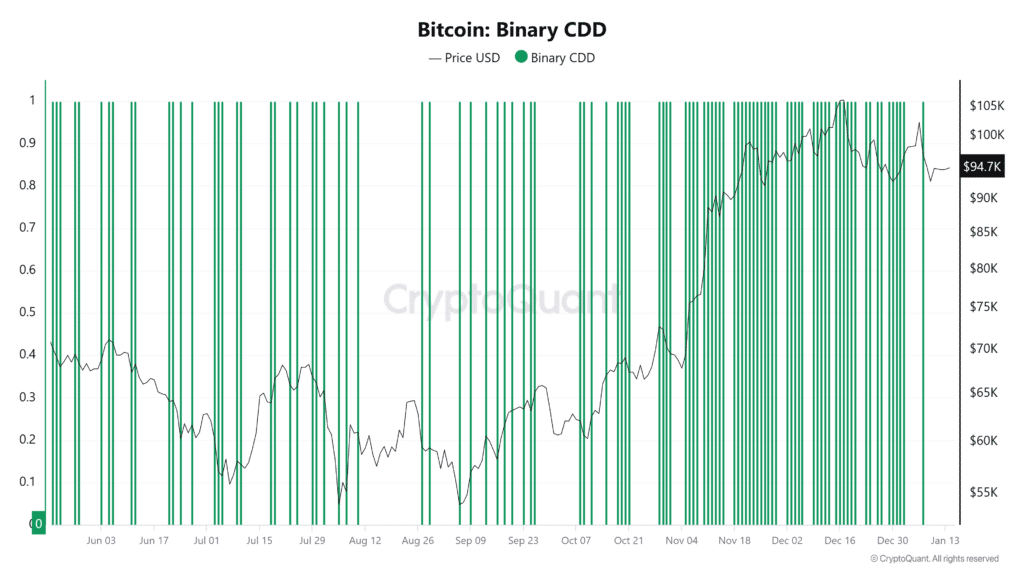
According to CryptoQuant’s Binary Coin Days Destroyed (Binary CDD), an indicator that tracks Long-Term Holder (LTH) activity based on binary values of 1 and 0, BTC holders are showing renewed confidence in the asset.
A value of one indicates LTHs are moving their assets, possibly to sell, while 0 reflects trust, with holders choosing to keep their BTC.
At the time of writing, BTC’s binary CDD was at zero, indicating that long-term holders were accumulating rather than selling.


Source: CryptoQuant
The derivatives market also reflects a bullish sentiment. The funding rate, which turned positive, rose to the highest level in four days. It rose from around 0.00393 on January 10 to 0.0124 at the time of writing.
This is the highest percentage since January 2.
Read Bitcoin (BTC) price prediction 2025-26
With continued buying activity in the perpetual market, long-term holders maintaining their positions, and the gradual accumulation by investors in recent months, BTC appears poised for a bullish rally.

