

Bitcoin Cash price recovered from the $160 zone against the US Dollar. BCH could be aiming a fresh rally towards the USD 240 and USD 250 levels.
- Bitcoin cash price is consolidating above the USD 180 level against the US dollar.
- The price is trading below USD 200 and the 100 simple moving average (4 hours).
- A major ascending channel is forming with resistance close to $200 on the 4-hour chart of the BCH/USD pair (data feed from Kraken).
- The pair is likely to accelerate higher as it clears $195 and $200.
Bitcoin Cash Price is preparing for the next step
After a strong decline, Bitcoin cash price found support near the USD 160 level. Trading from USD 160.90, BCH recently started a recovery wave, just like Bitcoin and Ethereum.
The price climbed above the USD 175 and USD 180 resistance levels. There was a break above the 23.6% Fib retracement level of the downward move from the $237 swing high to the $160 low. The price is now trading in a range above the USD 190 level.
Bitcoin Cash is now trading below $200 and the 100 simple moving average (4 hours). A major ascending channel is also forming with resistance close to USD 200 on the 4-hour chart of the BCH/USD pair.
The immediate resistance is near the $200 level, the channel zone and the 100 simple moving average (4 hours). The next major resistance is near USD 220 or the 76.4% Fib retracement level of the downward move from the USD 237 swing high to the USD 160 low.
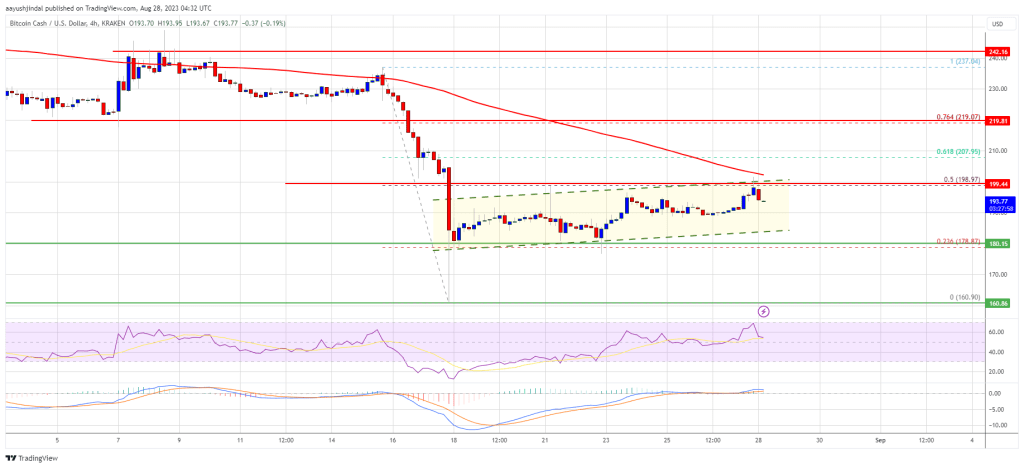
Source: BCH/USD at TradingView.com
Any further gains could lead the price towards the USD 240 and USD 250 resistance levels in the near term. The next major hurdle is near the USD 265 level.
Dips supported in BCH?
If Bitcoin cash price fails to clear the USD 200 resistance, it could trigger a fresh decline. The initial downside support is near the USD 185 level.
The next major support is around the USD 180 level, where the bulls are likely to emerge. If the price fails to stay above the USD 180 support, the price could test the USD 170 support. Any further losses could lead the price towards the USD 160 zone in the near term.
Technical indicators
4-hour MACD – The MACD for BCH/USD is losing pace in the bullish zone.
4-hour RSI (Relative Strength Index) – The RSI is currently above the 50 level.
Main Support Levels – USD 185 and USD 180.
Main Resistance Levels – USD 200 and USD 220.