

As Bitcoin (BTC) tries to break the $90,000 barrier, some analysts confirm that the flagship crypto’s bear market signals are becoming clearer, suggesting a breakout to new lows is looming.
Related reading
Bitcoin Bear Flag is raising concerns
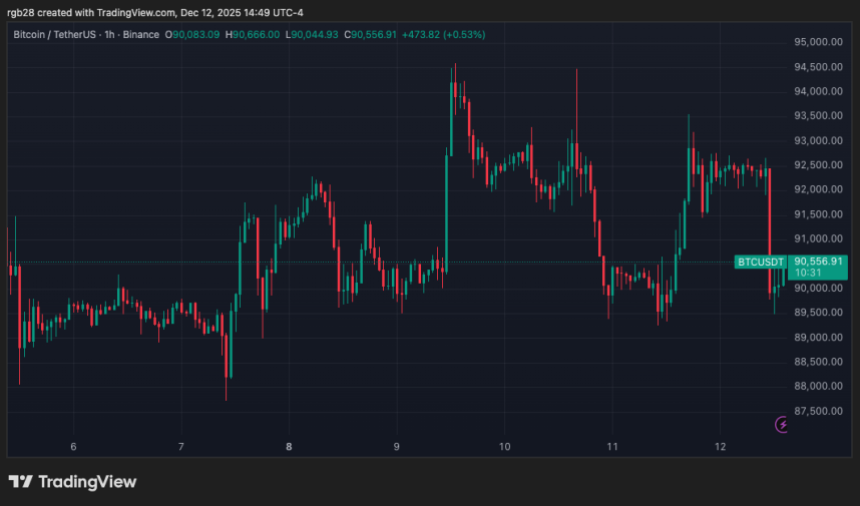
On Friday, Bitcoin wiped out Thursday’s gains, falling 3.2% intraday to retest the $89,500-$90,500 support zone. The cryptocurrency has traded between $84,500 and $94,500 for the past four weeks, briefly falling to a seven-month low of $80,600 during the late November correction.
This week, the price of the flagship crypto has seen more volatility, fueled by expectations of the Federal Reserve’s interest rate cut and positive regulatory developments in the US. However, BTC has failed to successfully break and hold above the upper limit of its local range after multiple retests, eventually falling towards the middle zone of its range.
Analyst Ted Pillows highlighted a worrying pattern on the Bitcoin chart, warning that the cryptocurrency risks a decline to new multi-month lows if the price fails to hold key support levels.
According to the post, BTC has been forms a bear flag for almost a month, which is “too hard to ignore” after the price continues to be rejected from the upper boundary of the formation. The analyst confirmed that this pattern follows a trend that has developed over the past two months.

As he noted, there have been bearish flags continuously formed on the BTC chart since the October 10 market pullback, with each pattern resolving into a breakdown to lower levels. For Ted, the new formation indicates that the overall trend is still downward.
He suggested that a close above the $96,000 level would negate the bearish pattern. On the contrary, a drop below the $86,000 support, where the lower limit of the formation is located, could push Bitcoin to the April low around $76,000.
Will the 2022 playbook repeat itself?
The market observer too noted a similarity between the last cycle and the current one, which could lead to a decline below the $70,000 level. The chart shows that after losing the 50-Week EMA indications, Bitcoin consolidated within a bear flag before collapsing and descending to the 2022 low.
Now BTC is showing a similar performance after losing the 50-week EMA and breaking the October bear flag. “If this happens, a pump to $100,000 and then a dump below $70,000 would follow,” the analyst added.
Meanwhile, Robert Mercer shared a similar perspective in a series of X-posts. The analyst confirmed that the classic four-year cycle has not changed despite the significant increase in institutional adoption:
Bitcoin breaks crucial support points one by one and enters a bear market. The same thing happened at the end of 2021. Right now BTC is forming a rising channel with the top near $100,000 – $104,000, you can see a clear right shoulder of H&S in this move. Something similar happened in early 2022.
Related reading
Nevertheless, he concluded that “such a breakdown will not happen without a retest,” predicting a rebound to $98,000-$102,000, followed by a decline to the support level of $55,000-$60,000.
At the time of writing, BTC is trading at $89,990, down 2.75% in the daily time frame.
Featured image from Unsplash.com, chart from TradingView.com