- Bitcoin was trading around $59,000 at the time of writing
- There seemed to be some capitulation of miners, but the big miners were still piling in
Bitcoin faced a significant capitulation from miners last week as its price fell, leading to greater miner outflows. This happened alongside a spike in mining difficulty, with the same reaching its highest level in years and putting additional pressure on miners. However, recent statistics indicate that this capitulation may be nearing its end, as Bitcoin showed signs of stabilizing somewhat.
Bitcoin sees capitulation from miners
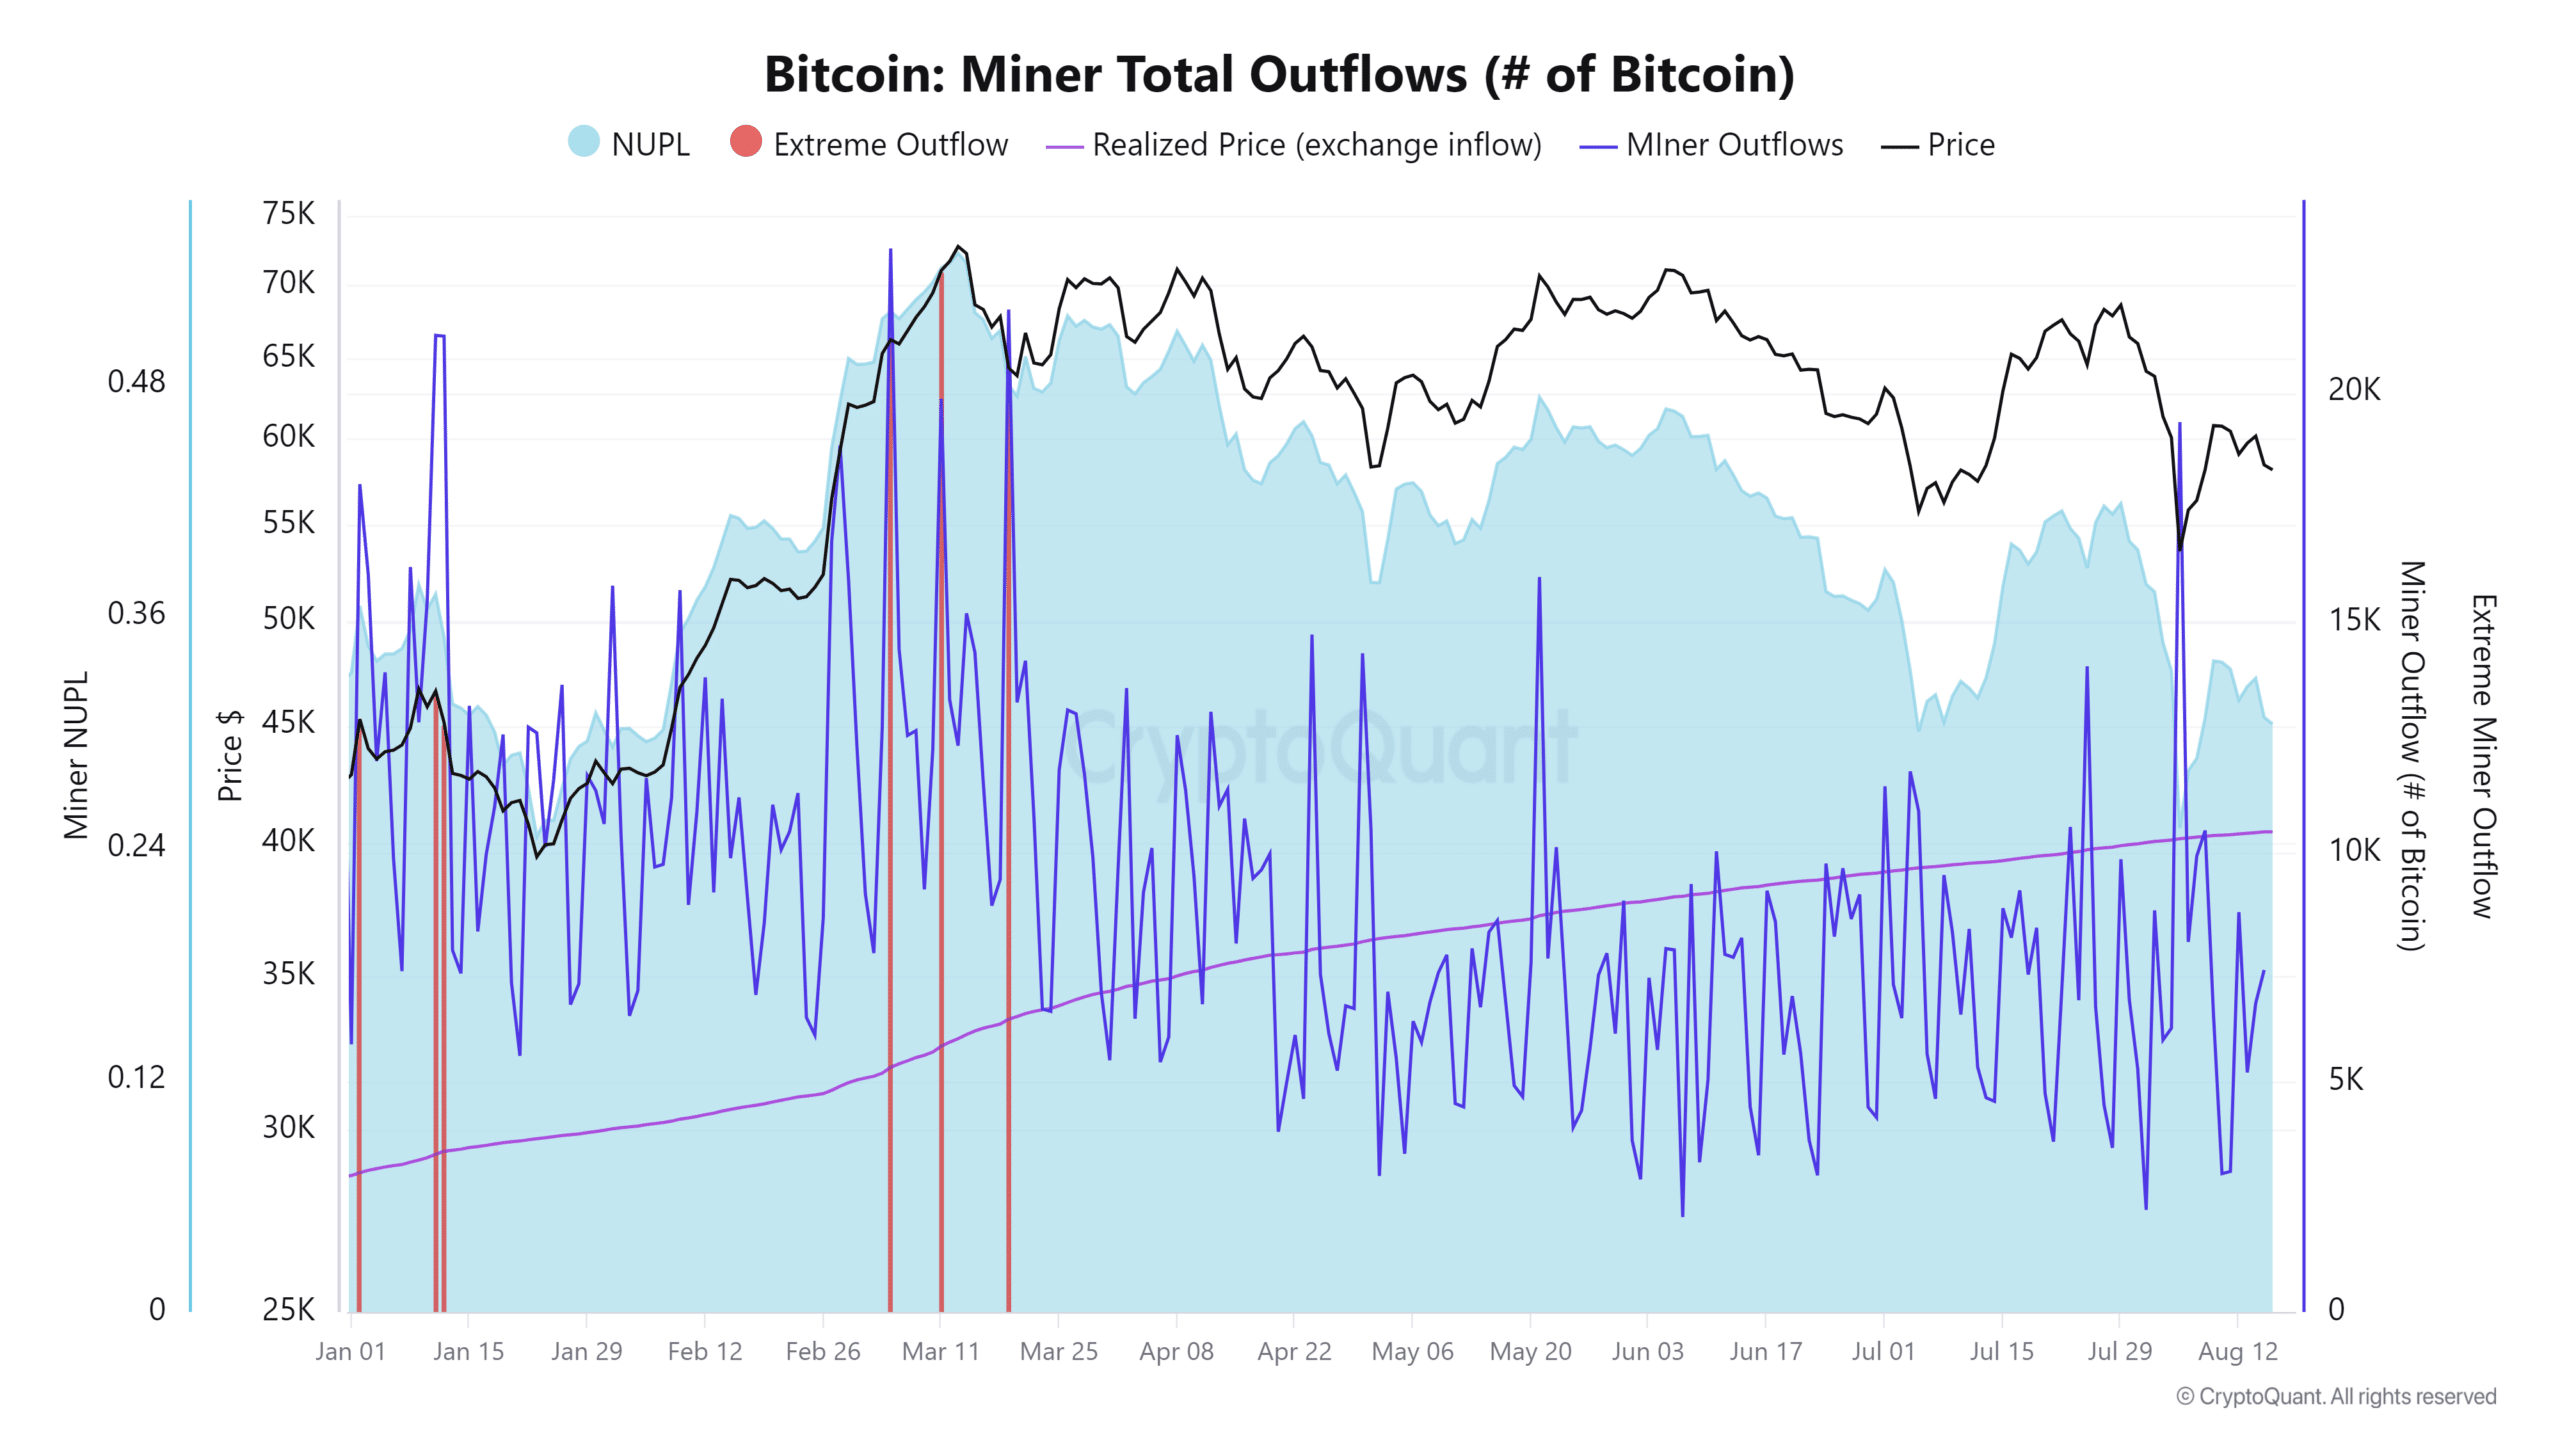
CryptoQuantBitcoin data showed that Bitcoin saw a significant capitulation from miners last week as its price fell to the $49,000 range. On August 5, daily miner outflows rose to 19,000 BTC, the highest level since March 18.
This sell-off occurred as miners faced increasingly narrow profit margins. The margin fell to 25%, the lowest since January 22.


Source: CryptoQuant
The analysis also found that some miners sold parts of their reserves, realizing a loss of $22 million – the largest daily loss since May 29. A sharp increase in hashrate and network problems prompted this wave of capitulation.
The statistics reached new record highs last week, putting additional pressure on miners’ operations. These challenging conditions forced miners to liquidate their holdings to cover costs, highlighting the pressures they faced during this period.
Current state of affairs of miners
That’s not all. Smaller miners’ assets hit rock bottom following the recent capitulation in the Bitcoin market.
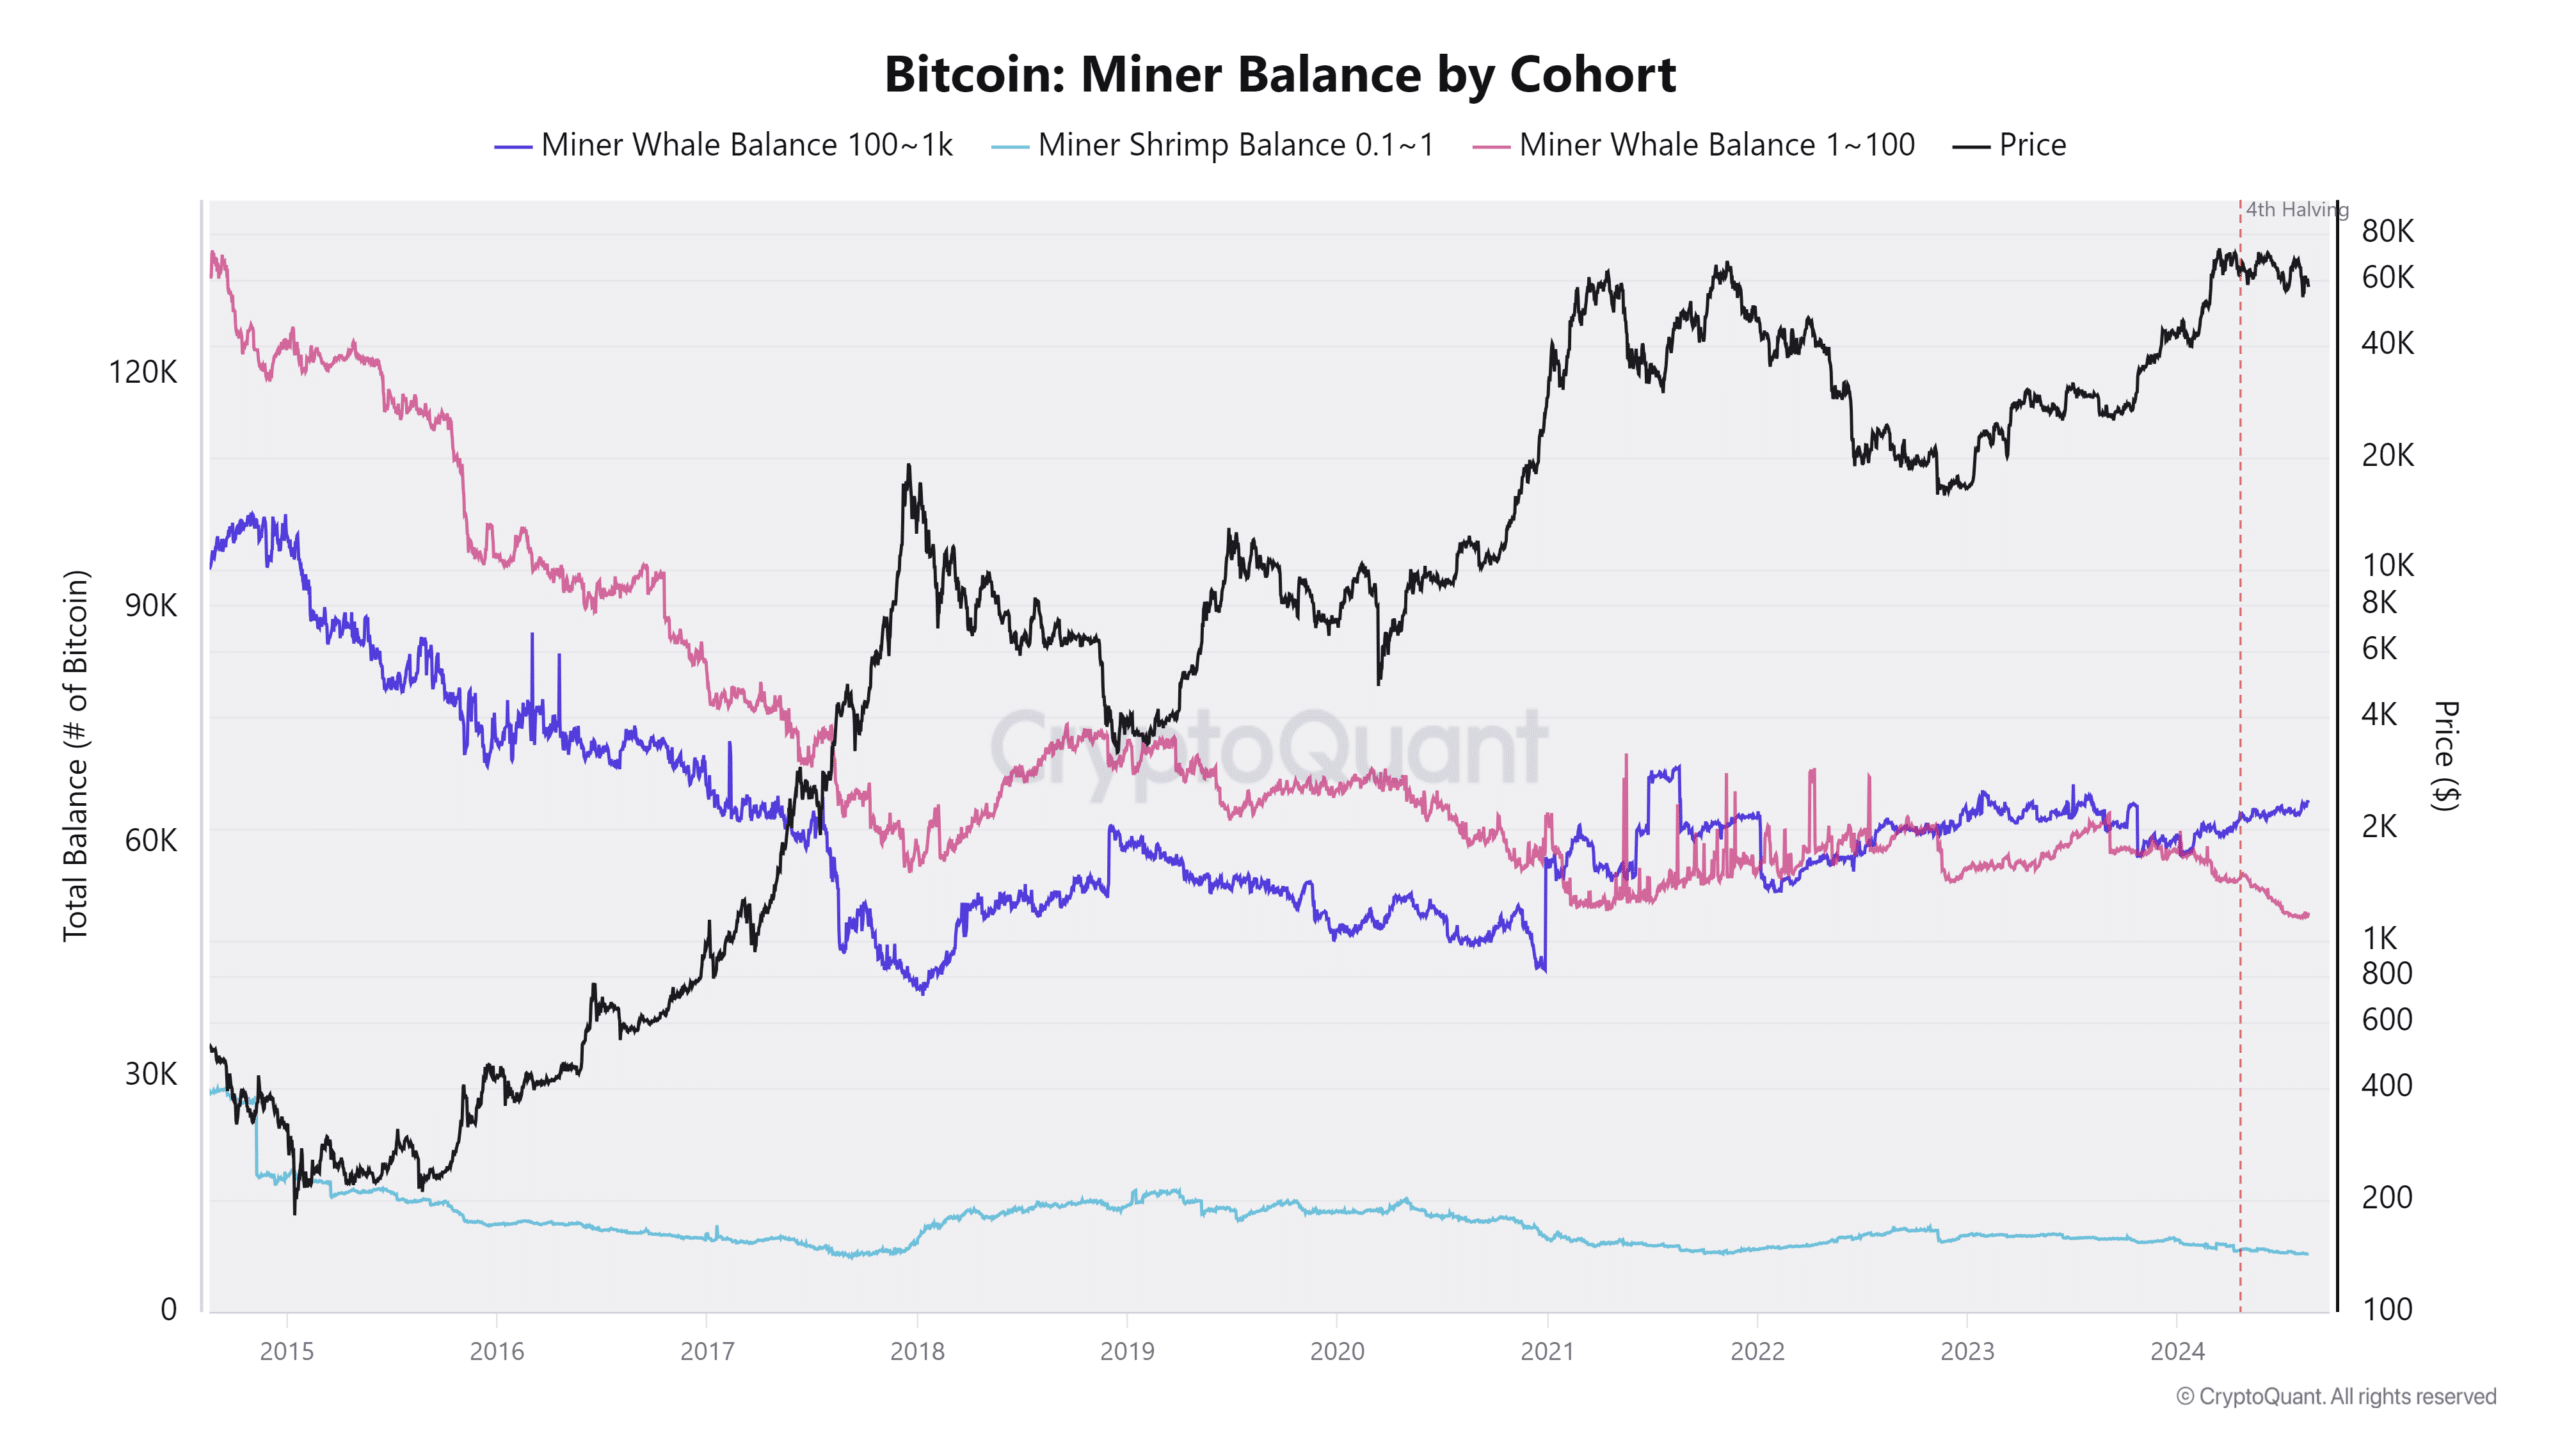
Data from Cohort’s Miner Balance revealed that even before this latest capitulation, smaller miners (pink line) were experiencing a steady decline in their Bitcoin holdings – a trend that was amplified after the second quarter halving.


Source: CryptoQuant
On the contrary, larger miners have increased their holdings. According to the above analysis, larger miners (violet line) have continued to accumulate Bitcoin, with their total holdings now standing at 66,000 BTC.
This accumulation by larger miners has contributed to a decline in overall Bitcoin capitulation. Especially since the price of BTC is showing a slight recovery.
Resistance at $60,000 despite recent gains
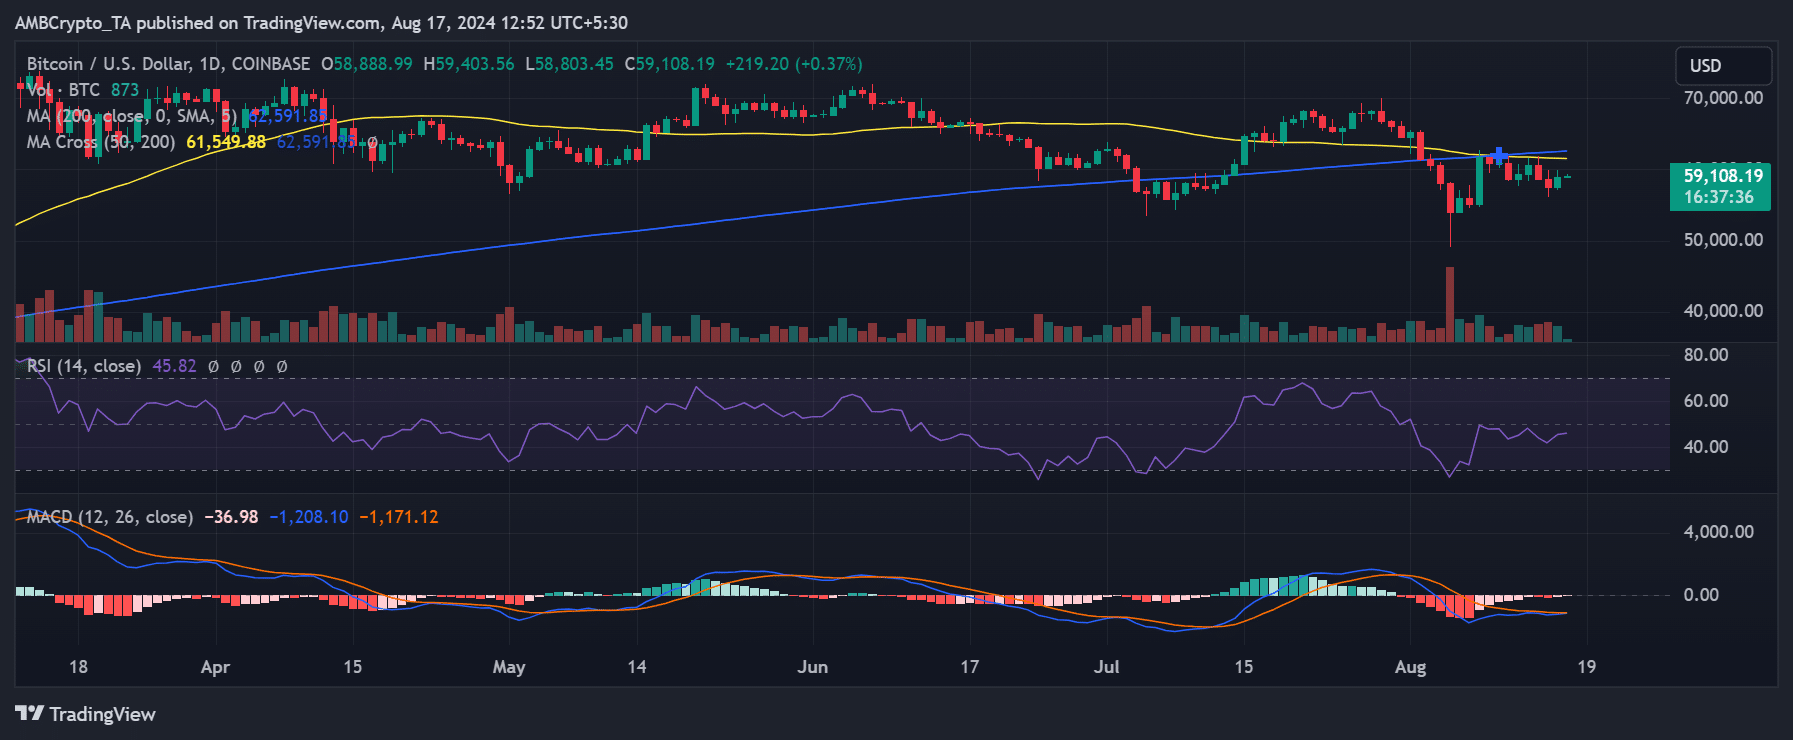
Since Bitcoin fell below its short- and long-term moving average (yellow and blue lines), the $60,000 price range has consistently served as a significant resistance level. Analysis of Bitcoin’s daily timeframe chart indicated that the yellow line marks resistance around $61,000, while the blue line marks another resistance point at around $62,000.
At the time of writing, Bitcoin saw a rise of over 2% in the last trading session to close above $58,000.
While this recovery is not yet a return to previous highs, it marks a positive move up from the recent dip to $49,000, which led to the capitulation of miners.


Source: TradingView
– Read Bitcoin (BTC) price prediction 2024-25
While still shy of breaking the critical resistance at $60,000, this rebound could speed up a gradual recovery.
However, Bitcoin must overcome these key resistance levels to regain stronger bullish momentum and move closer to its previous highs.

