
 – Here’s how traders can navigate THIS breakout")
- A break above $551.27 could lead to further gains, while a decline below $520.43 could signal more downside potential
- The long/short ratio of top traders on Binance and OKX revealed some hope for buyers
Since reaching the ATH in early June, Binance Coin (BNB) has gradually regained bearish momentum. It has fallen below key resistance levels (previous support) as it reflected the trend of the broader market.
In recent days, BNB has seen an expected decline in its chart pattern, pushing the price below the key EMAs. At the time of writing, BNB was trading around $534, down almost 2% in the past 24 hours.
BNB could see a near-term revival
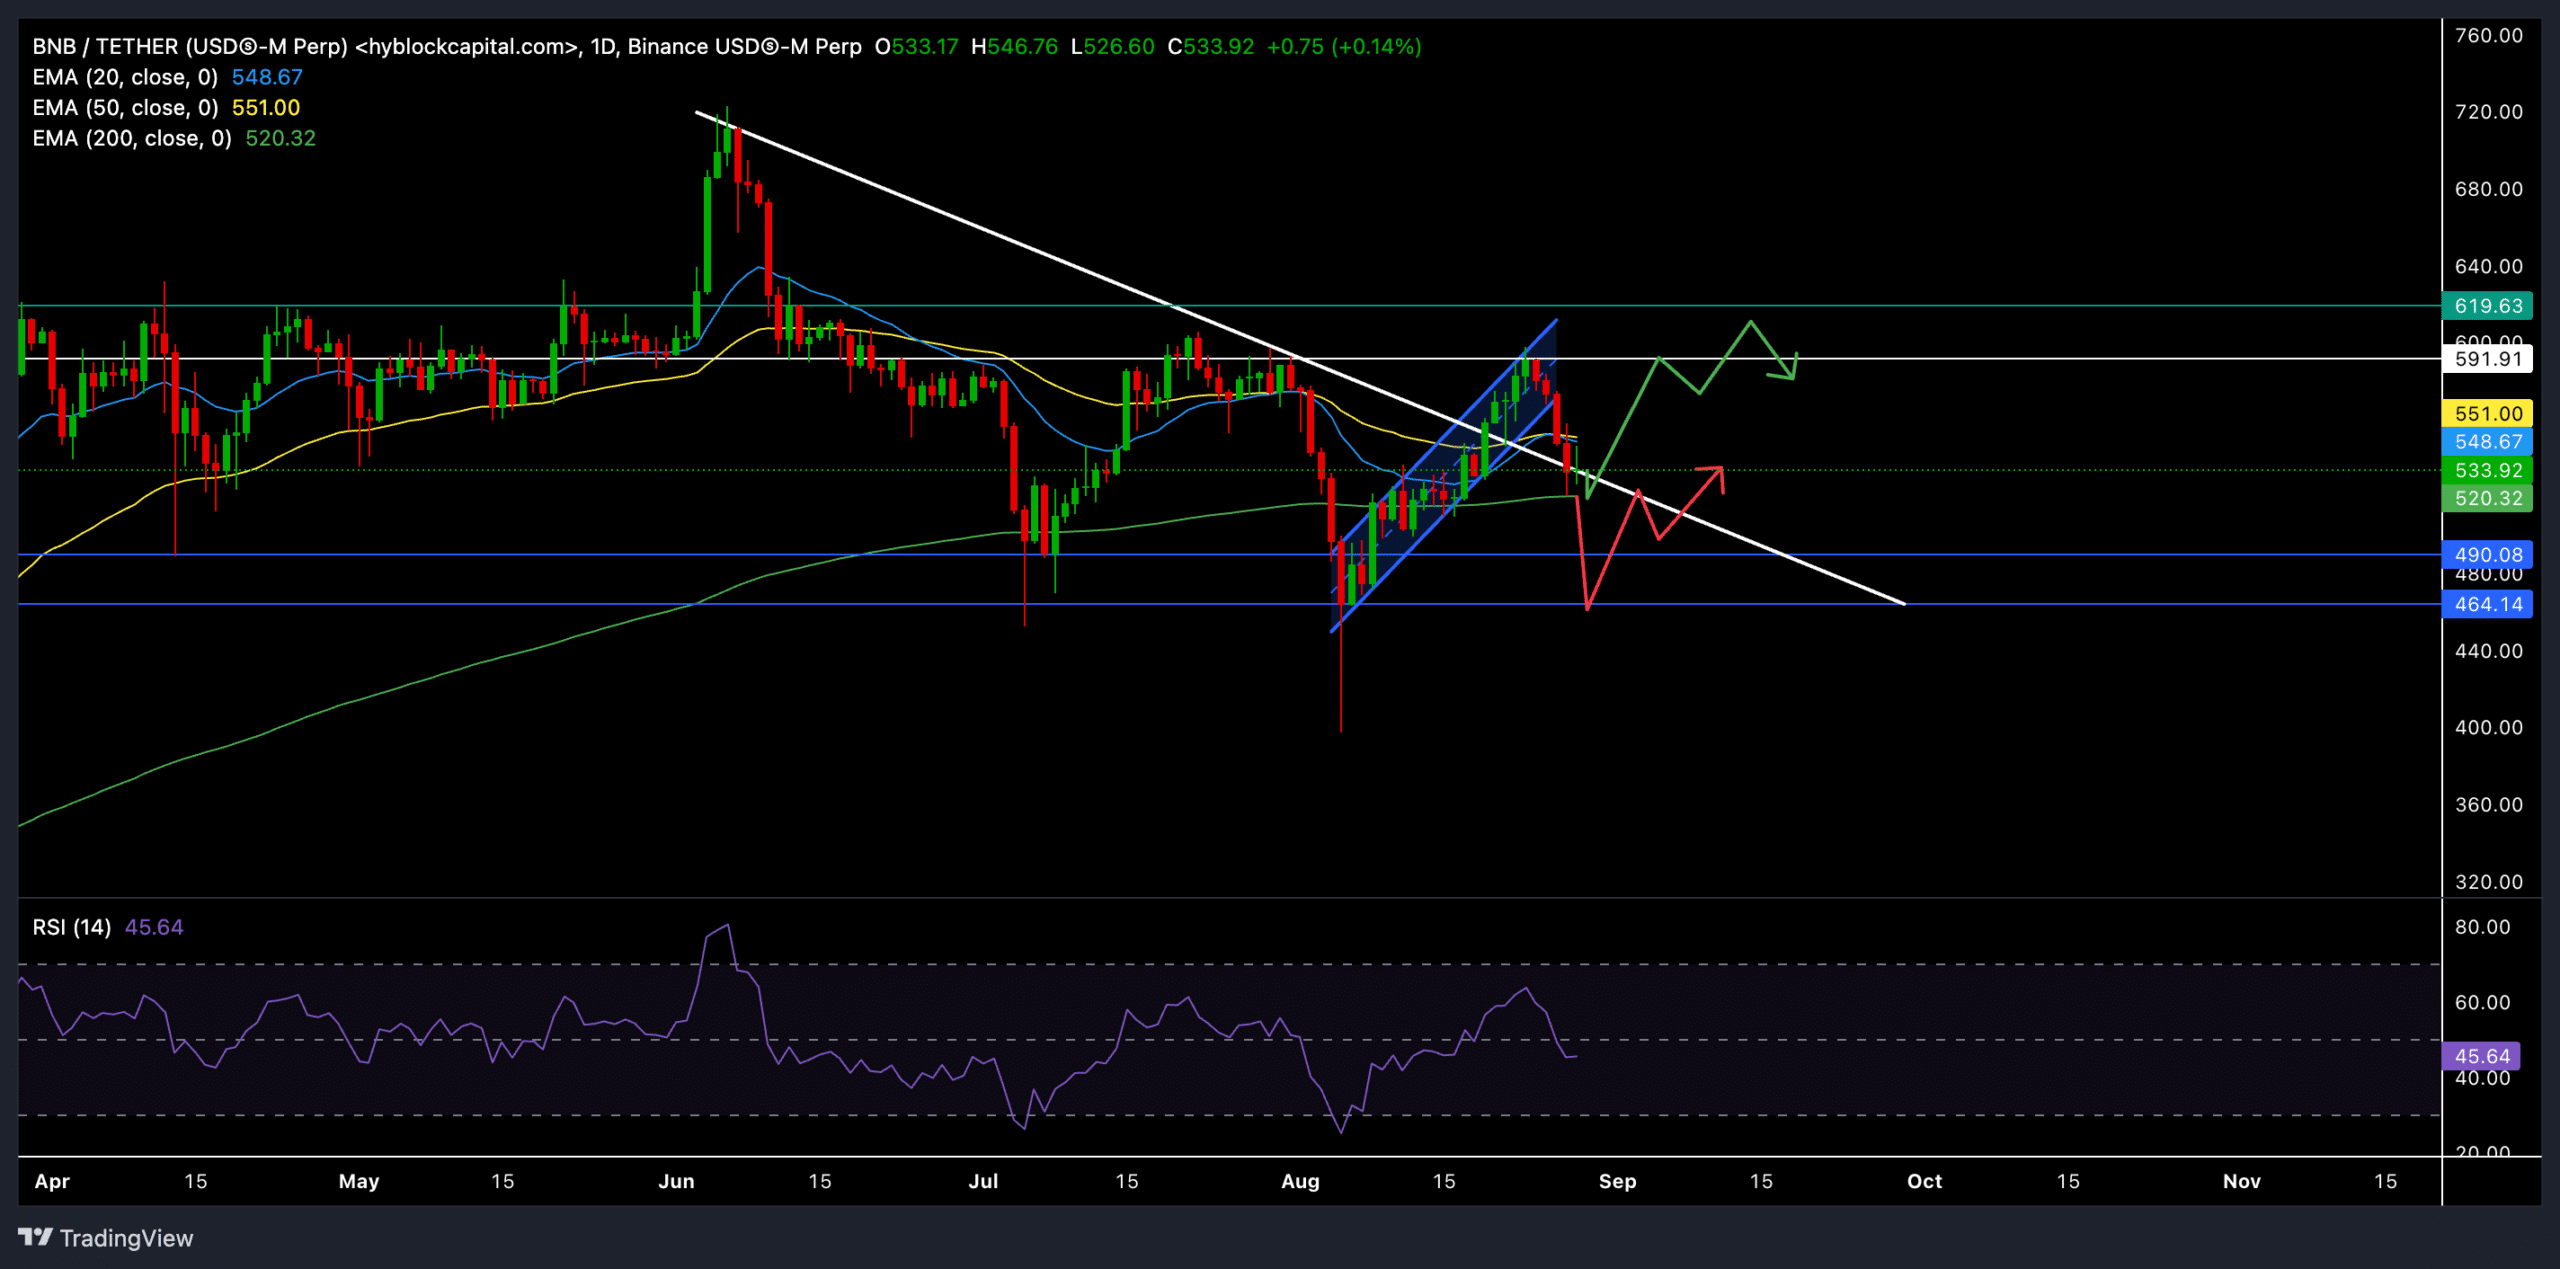
Source: TradingView, BNB/USDT
The latest daily chart shows that BNB is struggling to break above critical resistance levels. The price struggled within a narrow range, limited by resistance at $551.27 (50 EMA) and support at $520.43 (200 EMA).
A recent bullish breakout above the 20-day EMA (currently at $548) met strong resistance, and the price has since retreated.
The green and red projected paths on the graph indicated two potential scenarios. A continuation of the current uptrend could see BNB test the resistance at $591.91. On the downside, failure to hold above USD 541.00 could result in a retest of lower support levels around USD 490.08 and USD 464.14.
The Relative Strength Index (RSI) stood at 47.79 at the time of writing, indicating a fairly neutral market where neither bulls nor bears are in control. However, any close above 50 can confirm that selling pressure is easing.
Here it is worth noting that the altcoin recently broke above its long-term trendline resistance. So a recovery from the 200 EMA seemed quite likely.
The sentiment on the derivatives market
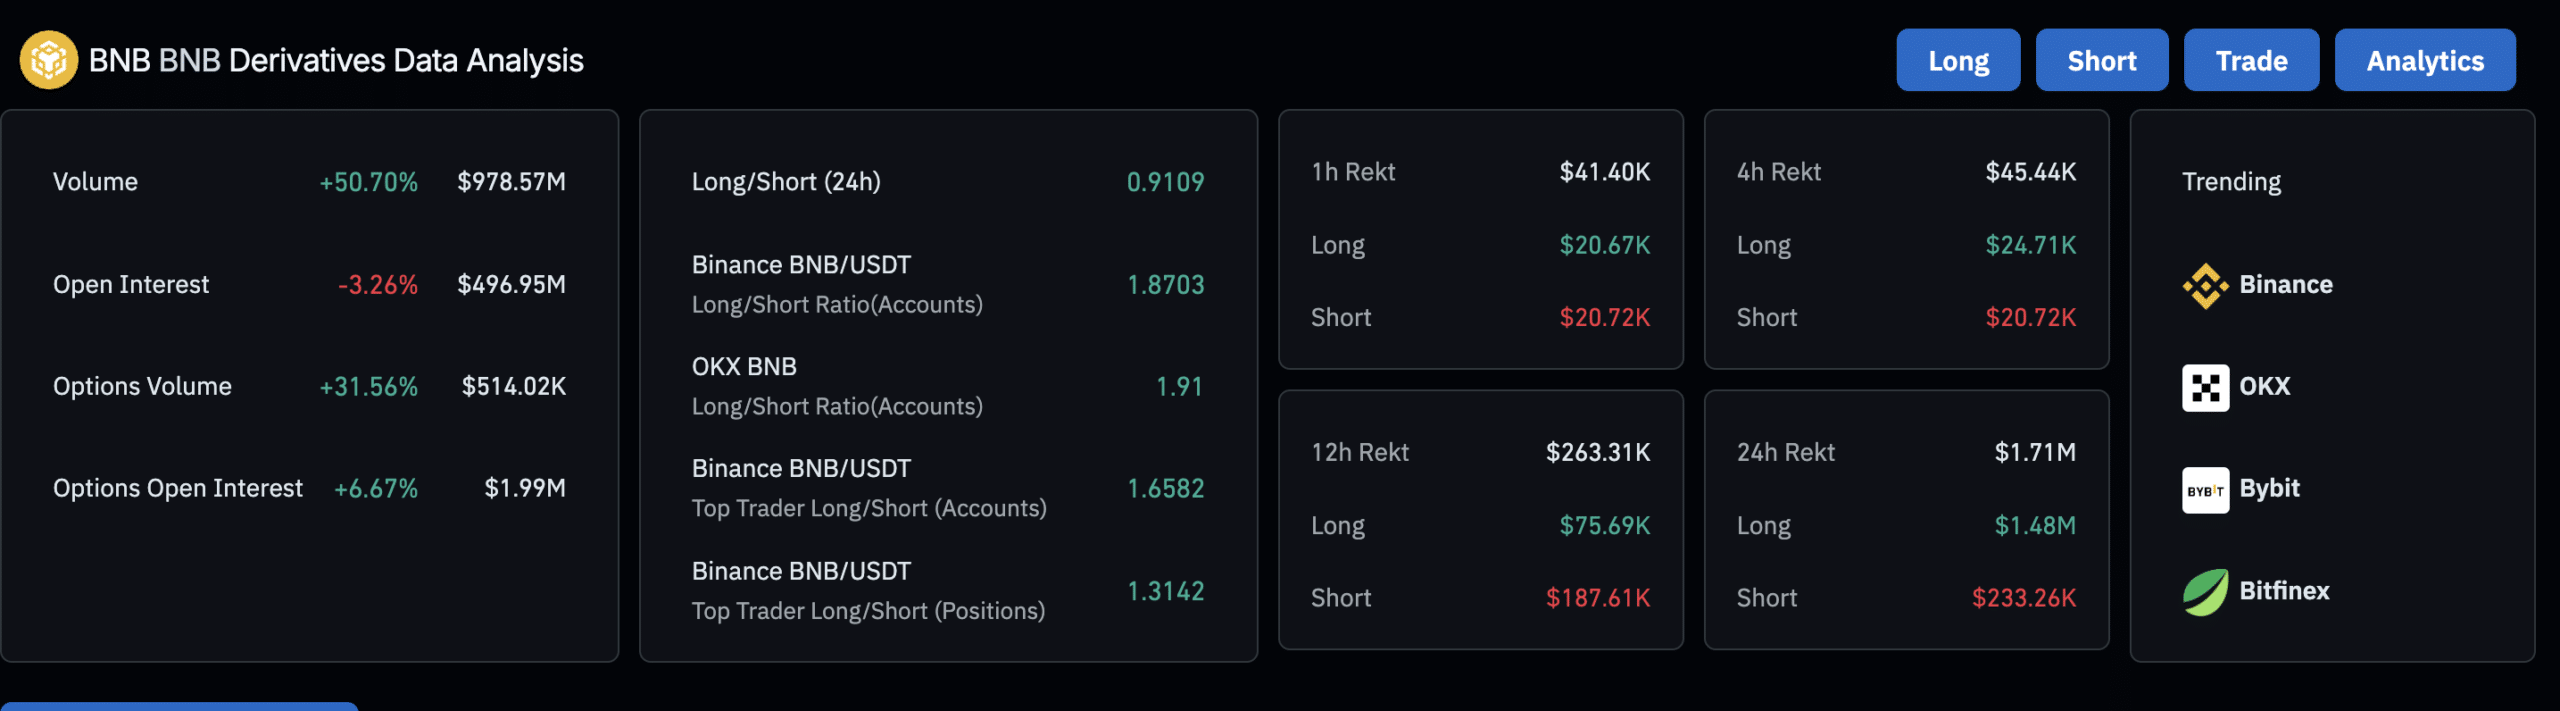
Source: Coinglass
The 24-hour long/short ratio was 0.9109, confirming a slight bias towards short positions. However, the long/short ratio on exchanges such as OKX and Binance appeared more favorable compared to longs, with ratios of 1.8703 and 1.91 respectively.
Despite the general bullish sentiment among top traders, Open Interest fell 3.26% to $496.95 million. This decline suggested that some traders are closing their positions, possibly in anticipation of greater volatility. Finally, volume rose 50.70% to $978.57 million, indicating increased trading activity.
As always, it will be crucial to keep an eye on Bitcoin’s movements, especially given BNB’s high correlation with BTC.