

intermediate
Learning how to trade crypto is no easy task. It is an arduous journey, from figuring out trading terminals and fees and finding your favorite pairs to learning how to read charts and perform your own technical analysis.
Technical indicators are an essential part of mastering the art of crypto trading. Although they no longer need to be calculated by hand, it can still be quite hard to learn what they show you and, perhaps even more importantly, which ones you should use and when.
What Are Cryptocurrency Technical Indicators?
Technical indicators are mathematical calculations based on historical price movement, volume, or open interest data. They aim to forecast future market behavior. In general, technical indicators can be used to measure the strength of a trend, identify potential reversals, and set entry and exit points.
There are many different types of trading indicators, each with its own strengths and weaknesses. Some technical indicators are more popular than others. Generally, each of them belongs to one of the two major categories: trend following/momentum indicator.
Trend-following Indicators
Trend-following indicators are designed to recognize and track the direction of a trend within the volatile cryptocurrency market. They offer insights on whether a crypto asset’s price is rising or falling over specific time frames, guiding traders’ decisions to buy or sell.
The Moving Average (MA) is an example of a trend-following indicator often utilized in trading strategies. MAs smooth out price data to create a trend line that doesn’t predict the price direction but instead defines the current price direction based on historical prices.
Momentum Indicators
Momentum indicators, in contrast, gauge the rate of price changes over pre-determined time periods. These comprehensive technical analysis tools are commonly used to spot overbought or oversold market conditions. Strong momentum indicates a likely continuation of the trend, while weakening momentum can suggest a potential reversal.
A frequently used momentum indicator is the Relative Strength Index (RSI), which oscillates between 0 and 100. It’s typically used to identify overbought (RSI > 70) or oversold (RSI < 30) conditions, which can signal upcoming reversals and inform trading strategies.
Moving Averages (MA)
The moving average (MA) is a simple yet effective technical indicator. It smooths out an asset’s price chart by creating a single flowing line that represents the asset’s average price over a given period of time.
Different types of moving averages exist, but the most common ones used in cryptocurrency trading are the Simple Moving Average (SMA) and the Exponential Moving Average (EMA).
The SMA is calculated by adding together all past closing prices and dividing them by the number of periods. On the contrary, the EMA gives more weight to recent prices. This makes it more responsive to recent price changes.
Both MAs can be used to identify trends and potential reversals. When the price is above the MA, it is generally considered to be in an uptrend. Conversely, when the price is below the MA, it is usually in a downtrend.

How to Use MA Indicators in Technical Analysis
Moving averages are quite a versatile tool. Some common strategies with this indicator include:
Trend following: you can use moving averages to identify the direction of the trend and trade accordingly.
Crossover: when the short-term moving average (for example, the 20 days one) crosses above the long-term one, it usually signals a bullish trend. If the opposite happens, then a bearish trend is likely to occur soon.
Support and resistance: the moving average indicator can also act as support and resistance. The price that is bouncing off the MA may have found its support level. Similarly, the price struggling to break above the MA has likely found its resistance level.
Here’s an example of how SMA works:

As you can see in the picture above, the SMA line briefly acted as a support level for Bitcoin’s price in 2020. When the BTC price went below the Simple Moving Average line, it had a brief bullish trend.
Moving Average Convergence / Divergence (MACD)
The MACD is a comprehensive technical analysis tool used to measure the market momentum.
The MACD is calculated by subtracting the 26-period Exponential Moving Average (EMA) from the 12-period EMA. The 9-day EMA of the MACD, which is called the “signal line,” is then plotted on top of the MACD.
This indicator is widely used to predict future trends and to time entries and exits.
How to Use the MACD Indicator
Now, let’s take a look at how the MACD indicator can be applied to your strategy.
Crossover: a crossover occurs when the MACD line crosses above or below the signal line. This can be used as a buy or sell signal, respectively.
Divergence: divergence occurs when the price and the MACD are moving in opposite directions. This could be a sign that a price reversal is about to happen.
Here is an example:

As you can see in the picture above, the MACD line had crossed above the signal line right before the bullish trend started. If you had followed the chart back then, you could have interpreted it as a buy signal and made a profit as the trading price of that asset started rising. A bit later, in the middle of February, the MACD crossed below the signal line, which gave a sell signal, thus preceding the downward price movement.
Relative Strength Index (RSI)

The Relative Strength Index (RSI) is a momentum indicator that measures how fast the price is moving up or down. You can also use it in technical analysis to identify whether an asset is overbought or oversold.
The RSI is calculated using the following formula:
RSI = 100 – 100 / (1 + RS)
RS = Average gain / Average loss
The RSI can range from 0 to 100.
How to Use the RSI Indicator
There are a few ways to use the RSI indicator in your technical analysis. Here are the most common strategies:
Divergence: divergence occurs when the price and the RSI are moving in opposite directions. This could signify a trend reversal.
Overbought and oversold levels: the RSI can be used to identify overbought and oversold markets. Readings below 30 may be considered oversold, while readings above 70 may be considered overbought.
An example:
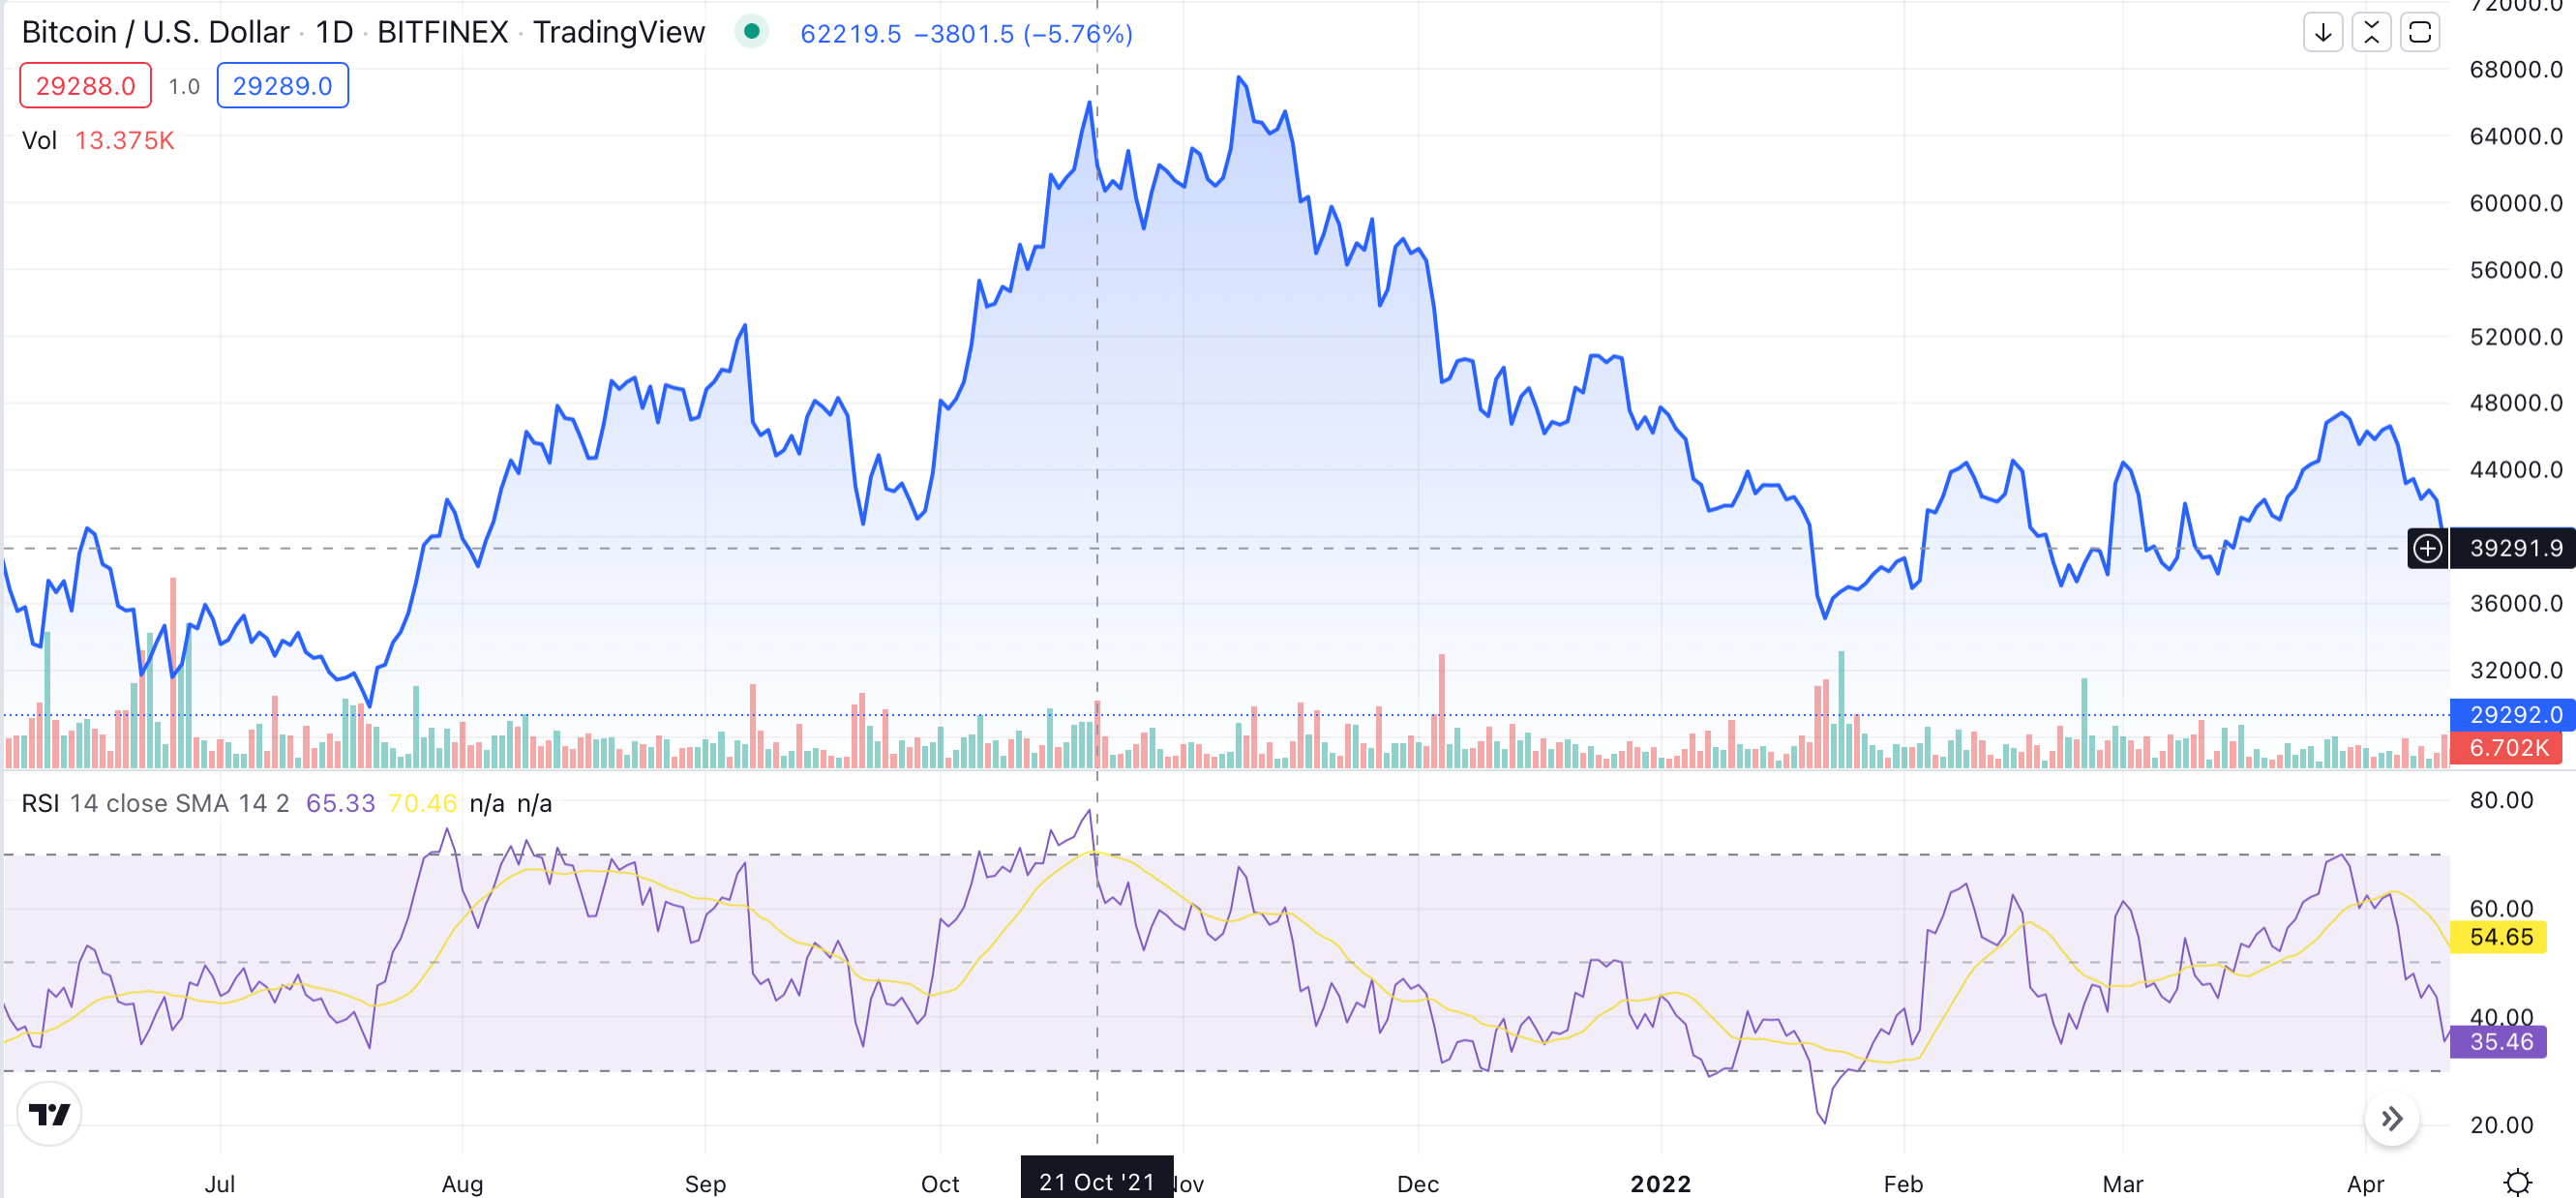
Let’s take a look at this Bitcoin price chart from 2021. As you can see, the RSI line started going down at the end of October, while the BTC price remained the same. This usually signals a trend reversal, and that’s exactly what happened: Bitcoin’s price momentum soon swung downward.
Bollinger Bands
Bollinger Bands are a technical indicator used to measure market volatility. They consist of Simple Moving Average (SMA) and two upper and lower bands. The upper band is calculated by adding the standard deviation to the SMA, while the lower band is calculated by subtracting the standard deviation from the SMA.

How to Use Bollinger Bands
BBs have two main use cases in crypto trading.
Divergence: divergence occurs when the price and BBs are moving in opposite directions. This could be a sign that the price is about to reverse.
Volatility squeeze: a volatility squeeze occurs when Bollinger Bands narrow sharply, meaning the volatility should be low. Widely radiating bands, on the other hand, indicate high volatility.
Let’s take a look at an example:

As you can see on the chart, narrow periods of BB coincided with low price volatility, while wide ones signified the beginning of more drastic price movements.
Additionally, you can use Bollinger Bands to predict price movements: when the price is hugging the upper border of the band, it is likely to continue to rise. But when the price is unable to reach the border, it is possible the short-term price momentum is about to reverse and swing downward.
Stochastic Oscillator
The Stochastic Oscillator is a momentum indicator that measures how fast the price is moving up or down.
The Stochastic Oscillator is calculated using the following formula:
%K = 100 × (C – L14) / (H14 – L14)
%D = 3-period SMA of %K
Where C = the most recent closing price
L14 = the low of the 14 previous trading days
H14 = the high of the 14 previous trading days
%K is the fast stochastic line, and %D is the slow stochastic line.
How to Use the Stochastic Oscillator
There are several common strategies that incorporate the Stochastic Oscillator. Here are the two most commonly used ones.
Overbought and oversold levels: the Stochastic Oscillator can be used to identify overbought and oversold levels. Readings below 20 may be considered oversold, while readings above 80 may be considered overbought.
Divergence: divergence occurs when the price and the Stochastic Oscillator are moving in opposite directions. This could be a sign that the price is about to reverse.
Here’s an example of how it works:
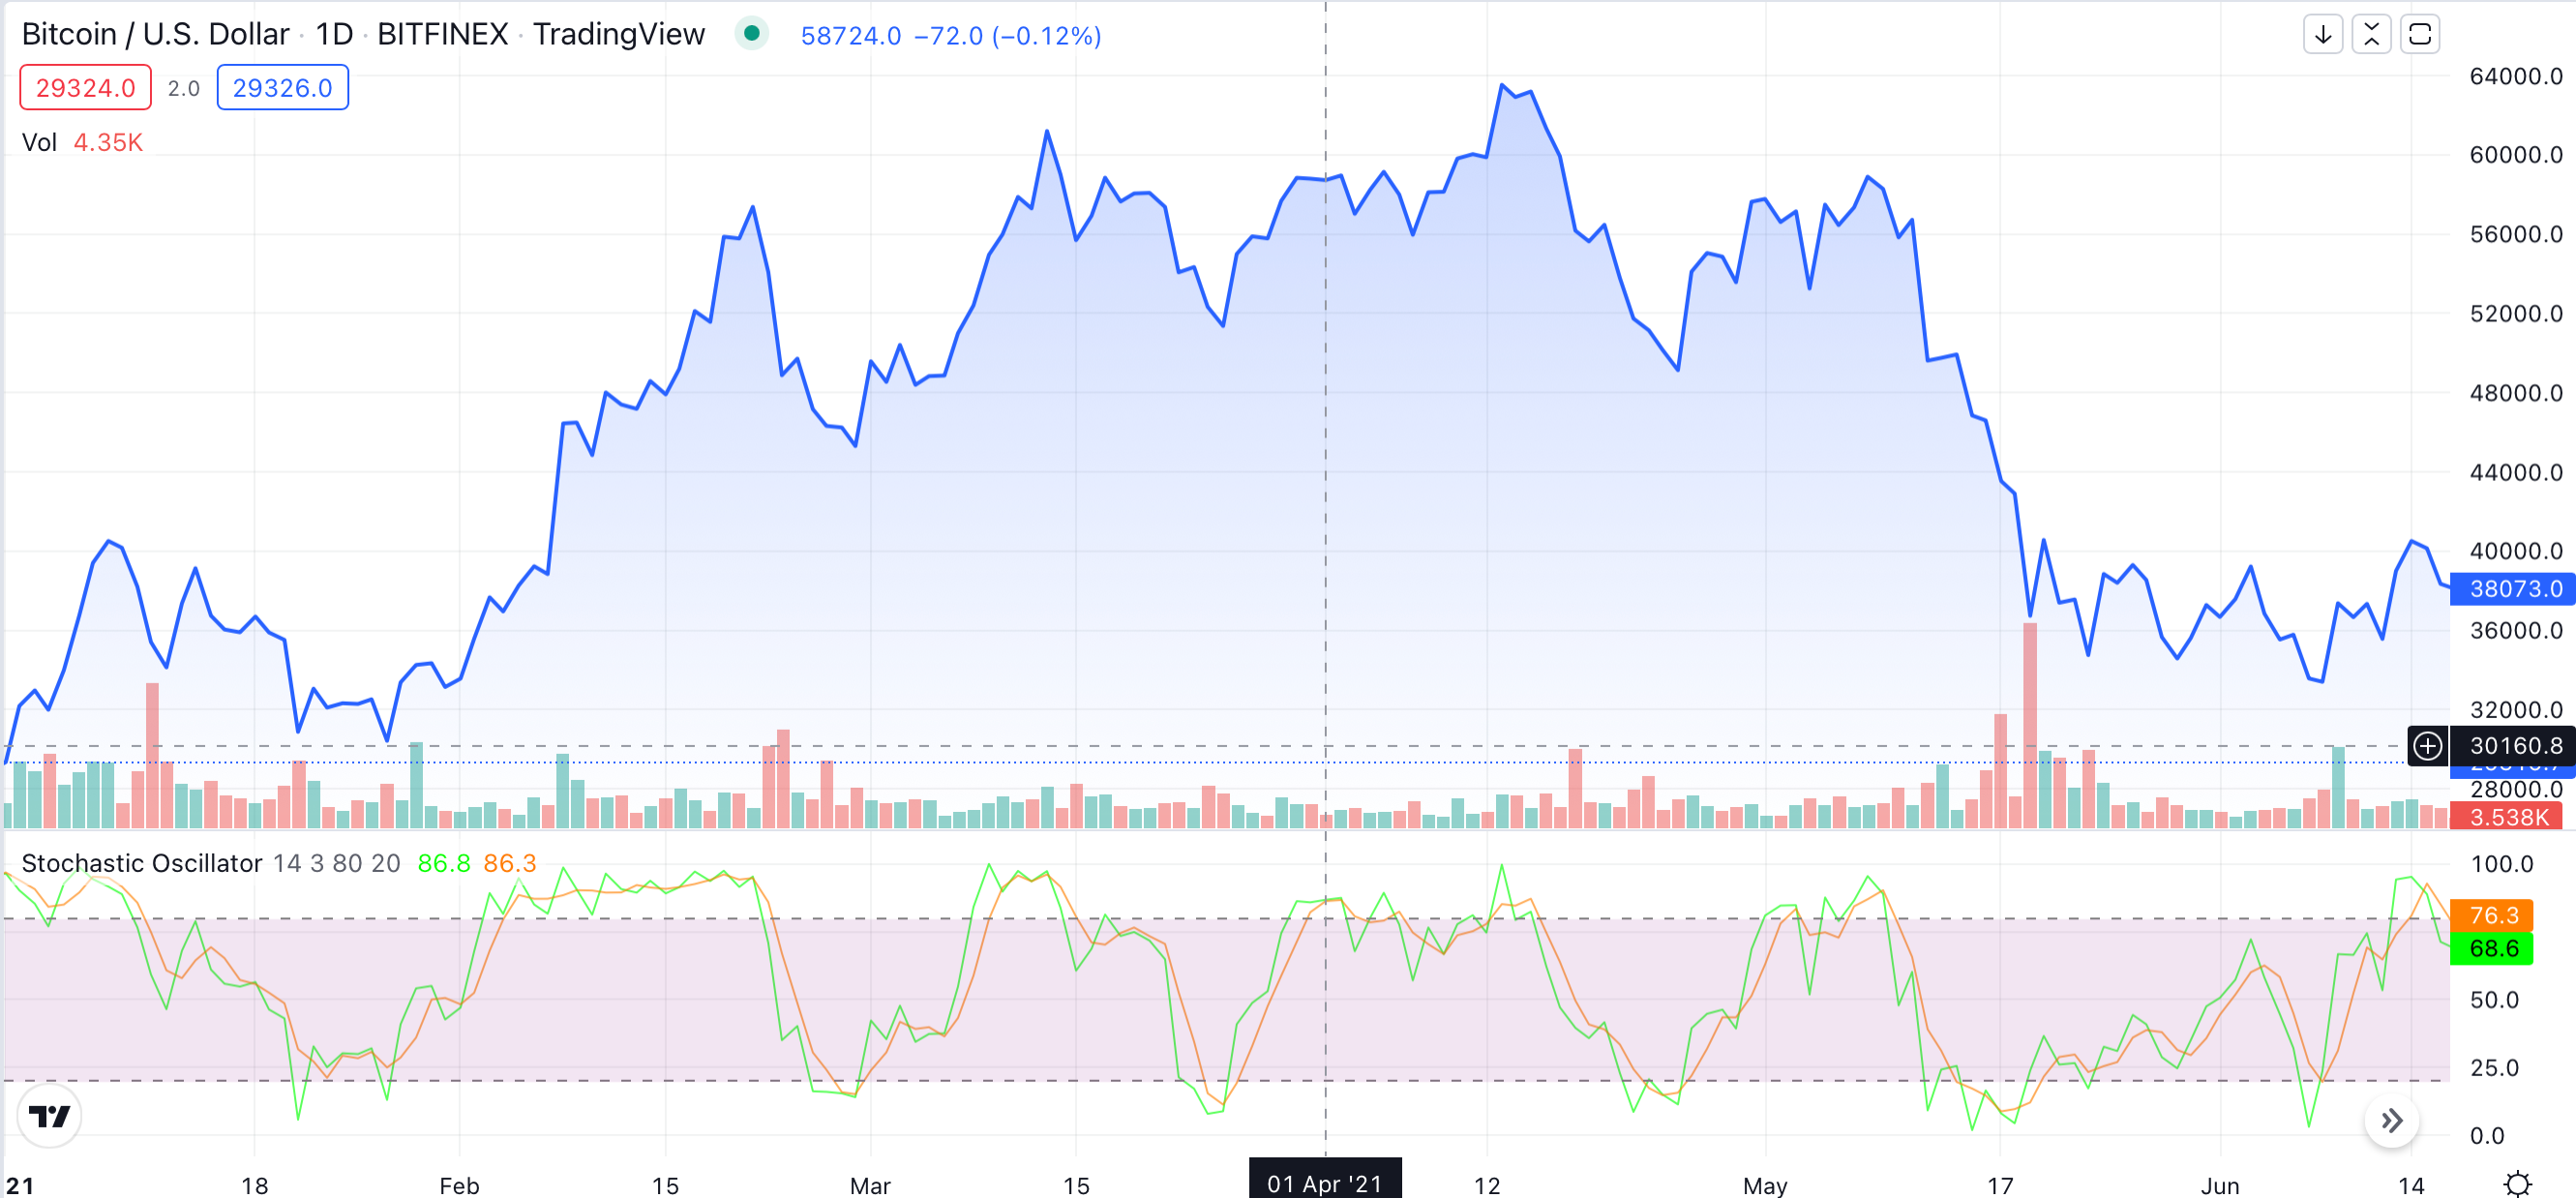
As you can see on the chart, the Stochastic Oscillator, was frequently giving signals that the asset (Bitcoin) was overbought and oversold. All overbought signals were followed by short-term price falls — and “oversold” signals. The price then bounced back, and the cycle repeated again.
This is a good example of how this indicator can sometimes be misleading when it comes to identifying long-term price momentum. We recommend against relying on just one indicator as they are more effective when used in combination.
Average Directional Index (ADX)
The Average Directional Index (ADX) is a technical indicator used to measure market trend strength. The ADX operates on the idea that the stronger the trend gets, the lower the risk is, and the higher the possibility of getting a profit rises. Although it uses price data, it does not directly correlate with the asset’s value. The ADX measures the strength of the current trend, regardless of whether the prices are going up or down.
The ADX is calculated using the following formula:
ADX = 100 × (abs(+DI–DI) / (+DI+DI))
Where +DI = 14-period positive directional indicator
–DI = 14-period negative directional indicator
How to Use the ADX Indicator
As part of your trading, the ADX could be applied in the following ways:
Trend strength: the ADX can be used to identify whether the market is trending or ranging. Readings above 25 may indicate a strong trend, while readings below 20 may indicate a weak one.
Divergence: divergence occurs when the price and the ADX are moving in opposite directions. This could be a sign that the price is about to reverse.
Volatility: if the ADX line is unable to keep consistent highs or lows and keeps going up and down, that can signal increased volatility in the market.
Now, let’s move on to the example:

Let’s take a look at this DOGE/USD price chart. As you can see, the ADX crossed over 20 on the 7th of August, 2021. Soon after, a bullish trend emerged. However, it was unable to keep consistent highs, and the DOGE price soon became volatile.
Parabolic Stop and Reverse (SAR)
The Parabolic SAR (Stop and Reverse) is a technical indicator used to identify potential reversals in the market. It can also help to gauge how likely the current crypto market trend is to continue.
The Parabolic SAR is calculated using the following formula:
PSAR = Prior PSAR + Alpha × (EP – Prior PSAR)
Where PSAR = Parabolic SAR
EP = Extreme point (the highest high for uptrends or the lowest low for downtrends)
Alpha = Acceleration factor (the default value is 0.02)
How to Use the Parabolic SAR
If you’re thinking of incorporating the Parabolic SAR in your trading, here are some of the widely used strategies:
Reversals: the Parabolic SAR can be used to identify potential reversals in the market. A buy signal is generated when the indicator turns from below to above the price, while a sell signal is generated when the indicator turns from above to below the price.
Trailing stop loss: the Parabolic SAR can also be used as a trailing stop loss. A buy order is placed when the indicator turns from below to above the price, and the stop loss is placed at the most recent SAR level. Similarly, a sell order is placed when the indicator turns from above to below the price, and the stop loss is placed at the most recent SAR level.
Here is an example:
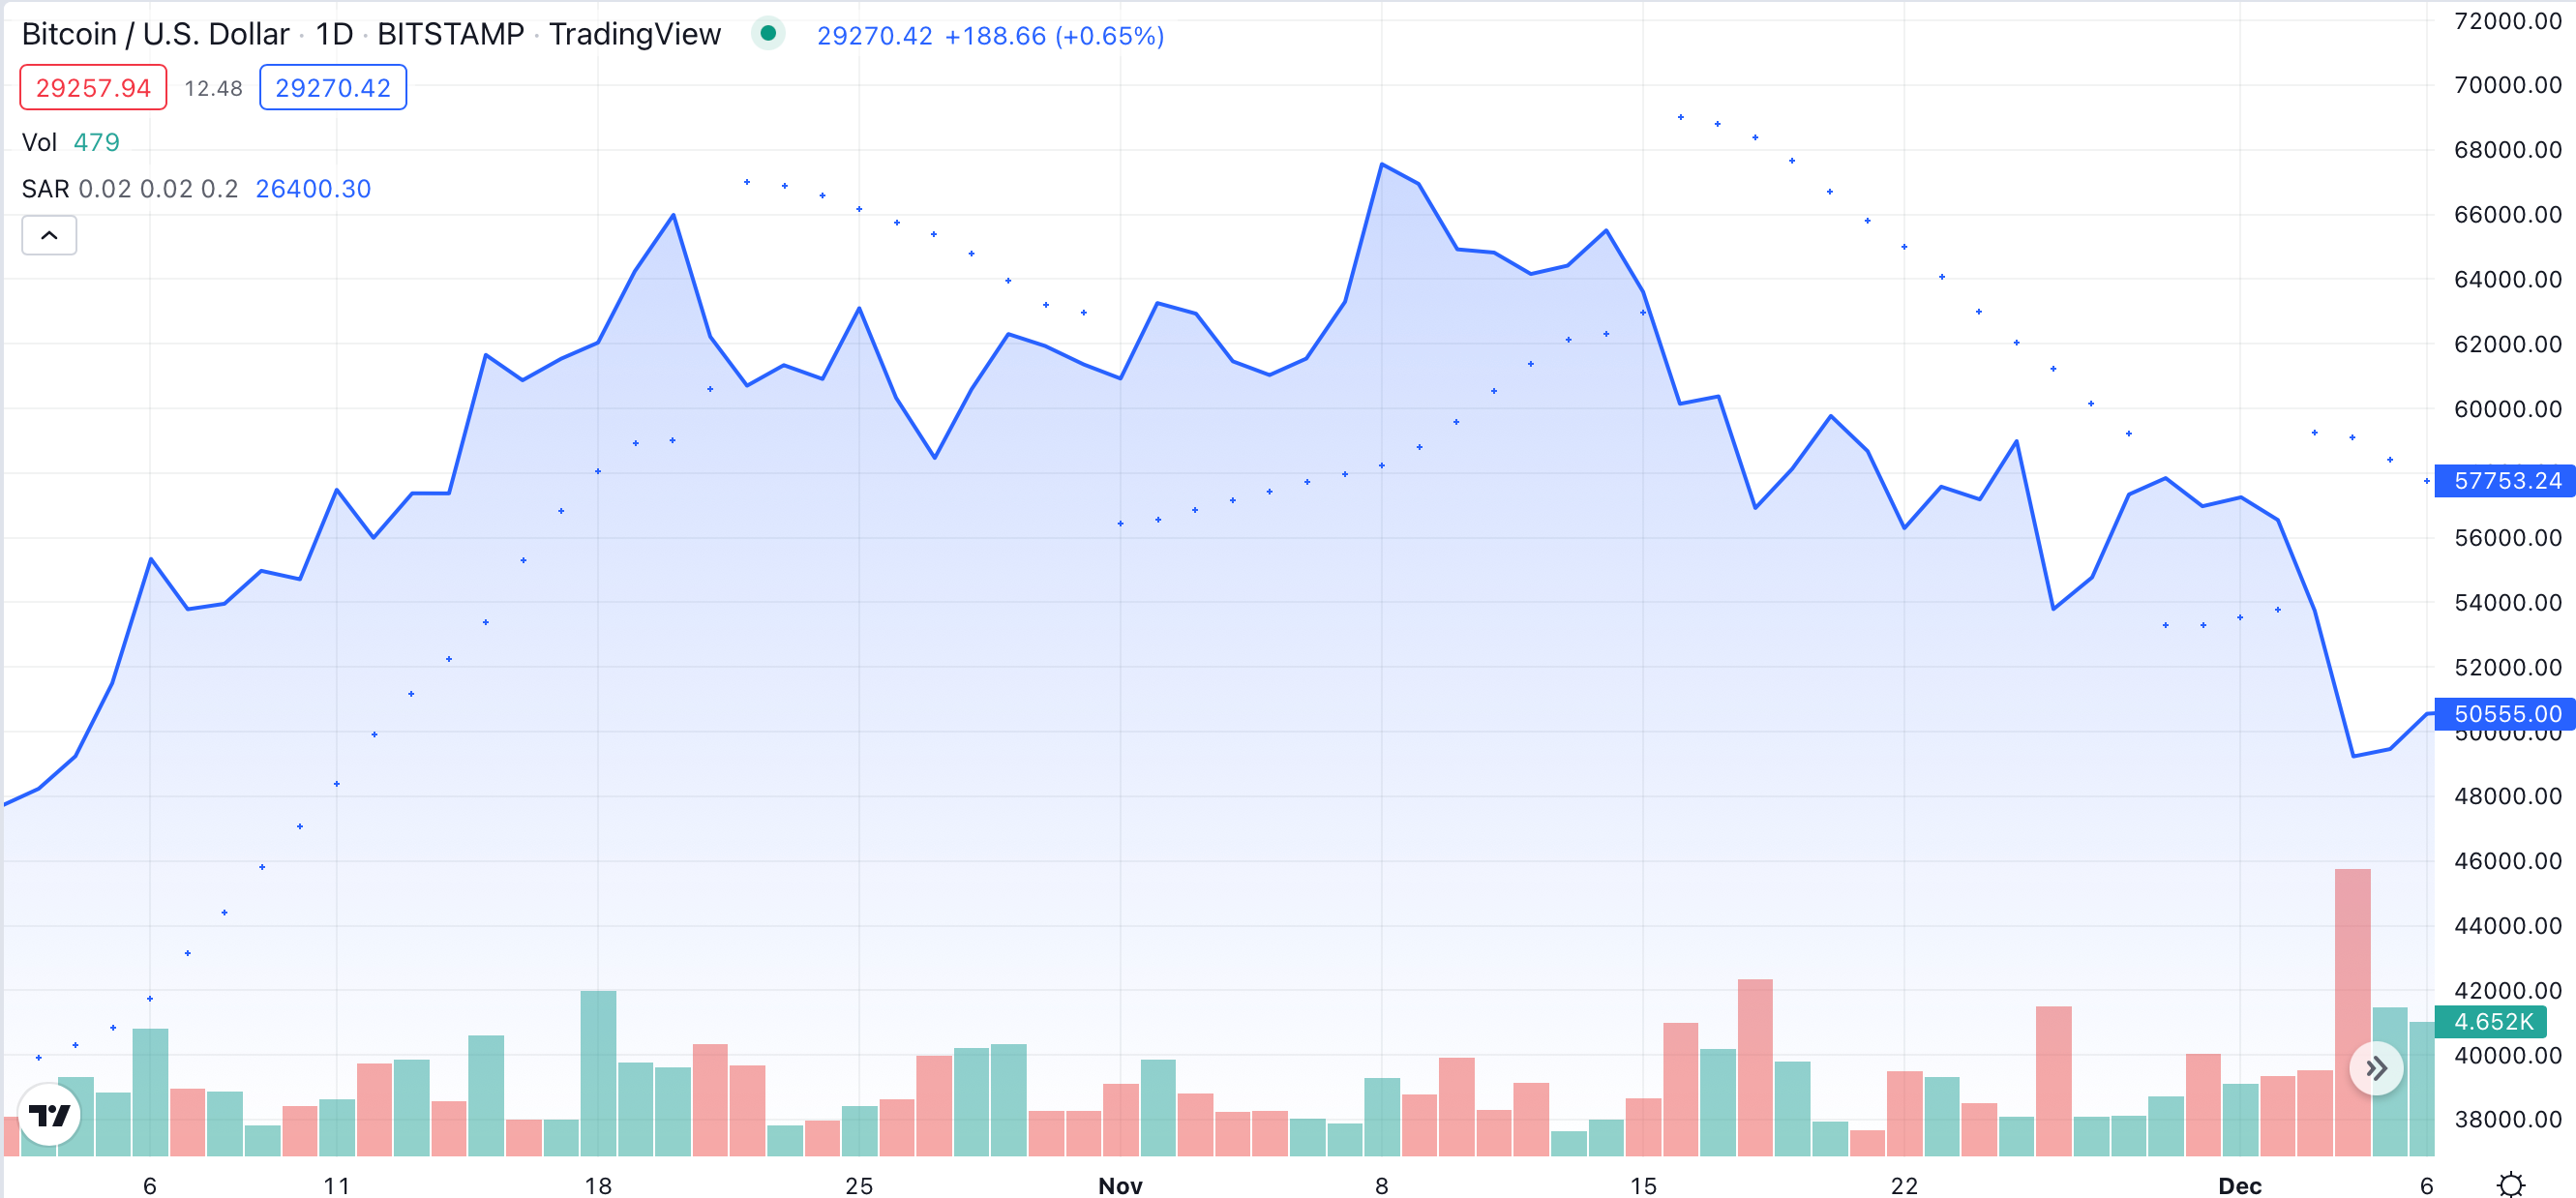
Let’s take a look at this BTC/USD trading chart. There’s a lot going on here: the position of Parabolic SAR dots has changed quite a few times. At first, the dots were firmly below the price, giving a bullish sign. At one point, there was a brief bearish sign; however, market participants managed to reverse it. The final trend reversal came after the Parabolic SAR got really close to the BTC price.
On-Balance Volume (OBV)
The On-Balance Volume (OBV) is a technical indicator that measures buying and selling pressure. The OBV is used in technical analysis to forecast an asset’s future price based on its volume.
The OBV is calculated using the following formula:
OBV = Previous OBV + Current Volume
How to Use the OBV Indicator
How could one actually use the OBV indicator? Let’s review some strategies:
Confirmation: the OBV can be used to confirm price movements. A rising OBV indicates that buying pressure is increasing, while a falling OBV signifies that selling pressure is increasing.
Divergence: divergence occurs when the price and the OBV are moving in opposite directions. This could be a sign that the price is about to reverse.
Let’s consider the example below:

Here, the OBV revealed that although Bitcoin’s price was rising, there was no buying pressure to back it up, which inevitably led to a bearish trend.
Ichimoku Cloud (IC)
The Ichimoku Cloud (IC) is a technical indicator used to identify potential support and resistance levels as well as trend direction. It is one of the most complex indicators for crypto trading.
The IC consists of five lines:
- Tenkan-sen, also called the Conversion line, is the midpoint of the last 9 candlesticks.
- Kijun-sen, also called the Base line, is the midpoint of the last 26 candlesticks.
- Senkou Span A, or Leading Span A, is the moving average of the Base and the Conversion lines. It is plotted 26 periods into the future.
- Senkou Span B is the moving average of the last 52 price bars.
- Chikou Span, or the Lagging Span, is the closing price of the current timeframe.
Together, Senkou Spans A and B form two boundaries of the cloud called the Kumo cloud.
How to Use the IC Indicator
If you’d like to learn about the ways to apply the IC to your trading, read about some popular strategies below:
Support and resistance: the IC can be used to identify potential support and resistance levels.
Trend direction: the IC can also be used to identify the direction of the trend. A buy signal is generated when the price moves above the cloud, while a sell signal is generated when the price moves below the cloud. Additionally, if the cloud turns red, it signals the beginning of a bearish trend.
Let’s take a look at this example.

Here, the Kumo cloud turned red on December 21 and was followed by a long period of price decline. Although the price had already been declining prior to that, this was probably one of the major points that solidified BTC’s price movement for the near future. As crypto prices are volatile, traders always expect them to bounce back, and the cloud turning red probably warned some of them that it is unlikely to happen.
FAQ
What is the most effective indicator?
There is no one-size-fits-all answer to this question. All effective strategies use different combinations of indicators instead of just one.
What is the most accurate trading indicator?
Even the best technical analysis indicators can be inaccurate. In order to get the best reading, try using a combination of different indicators (e.g., RSI with ADV and MACD).
Do professional traders use indicators?
Many professional traders use indicators as part of their trading strategy. They are a useful tool for both honing your trading skills and making a maximum profit once you’re already an expert.
What are the best exit indicators?
Some of the best exit indicators include the Relative Strength Index and the Moving Average Indicator.
What are the best RSI settings for day trading?
The key to using RSI effectively in your day trading strategy is setting the correct timeframe. Most expert day traders prefer using the 2 to 6 timeframe.
What are the best stochastic settings for day trading?
You should choose the settings that will suit your strategy best. If you’re a day trader, low settings for all variables may be a better choice. That will give you earlier signals, which is key in the highly competitive short-term trading environment.
What are the best indicators for scalping?
Scalping is a trading strategy that aims to profit from small changes in prices. The best trading indicators for this strategy are the Simple and Exponential Moving Average indicators, the Moving Average Convergence Divergence, the Parabolic SAR, and the Stochastic Oscillator.
Disclaimer: Please note that the contents of this article are not financial or investing advice. The information provided in this article is the author’s opinion only and should not be considered as offering trading or investing recommendations. We do not make any warranties about the completeness, reliability and accuracy of this information. The cryptocurrency market suffers from high volatility and occasional arbitrary movements. Any investor, trader, or regular crypto users should research multiple viewpoints and be familiar with all local regulations before committing to an investment.