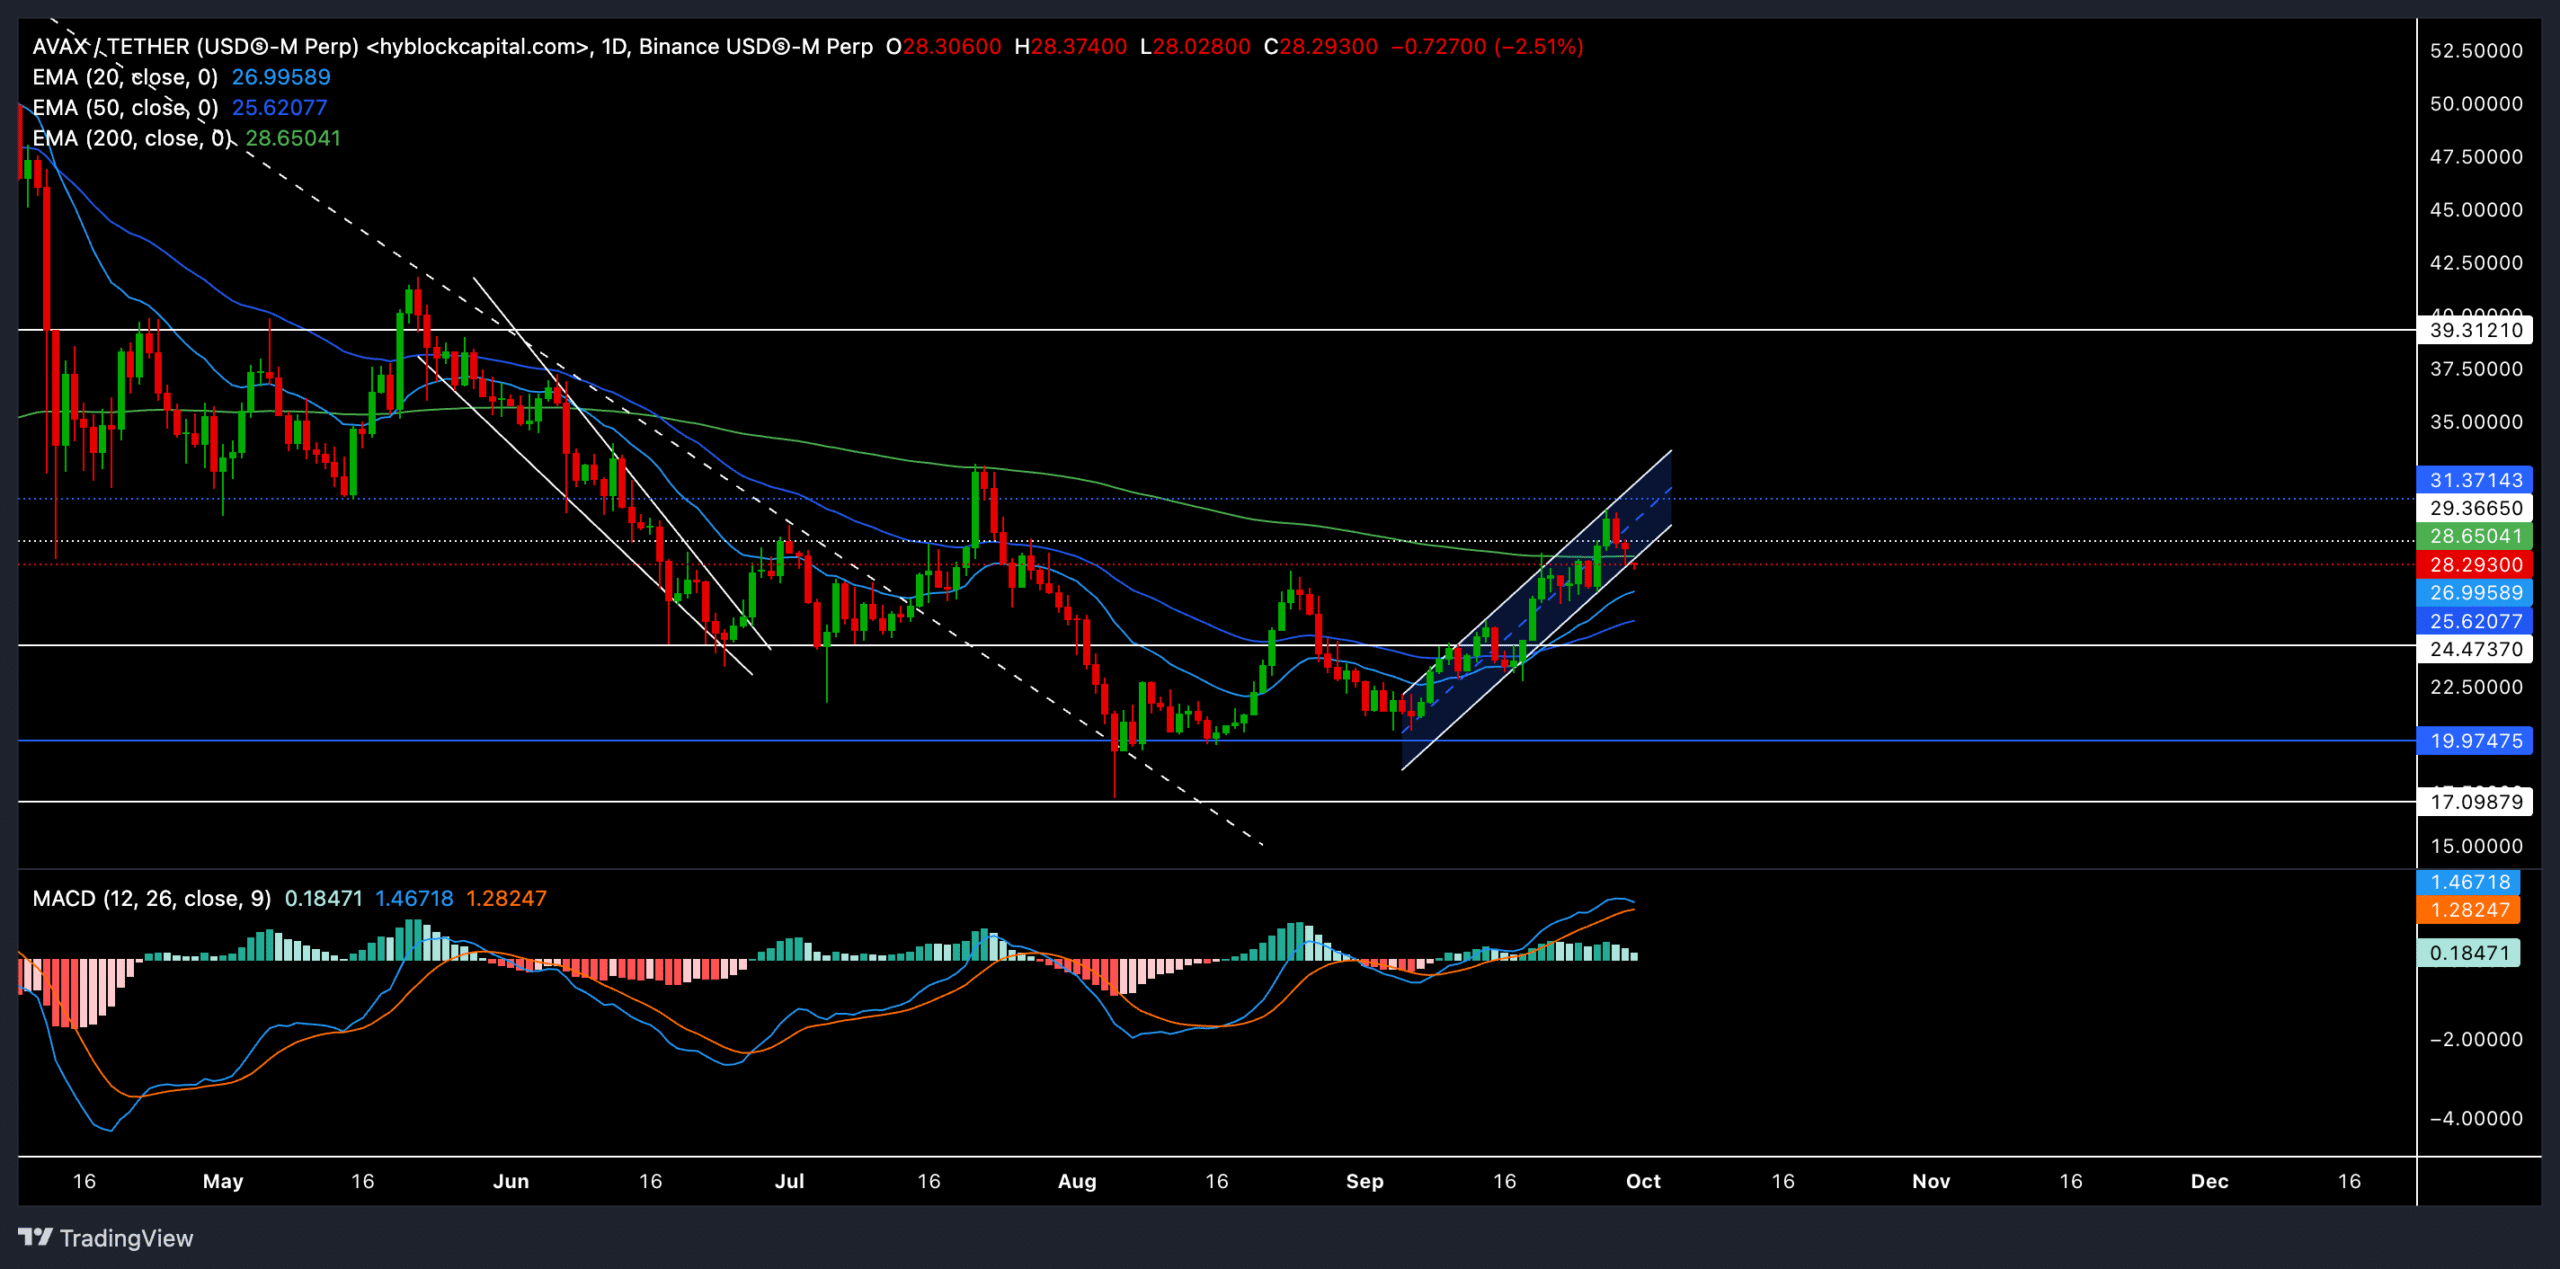
- Any further losses could confirm a break in the up-channel on the daily chart.
- The derivatives data indicated cautious but slightly bullish sentiment among top traders, which could stabilize the current uptrend.
Avalanche [AVAX] continued the uptrend of recent weeks within an ascending channel.
After breaking above the 50-day EMA, the bulls established a steady uptrend and pushed the price towards the 200-day EMA.
However, the recent price action suggested the potential for a pullback as key resistance levels approached.
AVAX was trading at $28.29 at the time of writing, down about 2.51% in the past 24 hours. Despite this dip, bullish momentum remained intact thanks to a northern 20-day EMA crossing above the 50-day EMA.
Can AVAX Bulls Cause a Long-Term Uptrend?


Source: TradingView, AVAX/USDT
The 20-day EMA of $26.99 and the 50-day EMA of $25.62 showed an upward trajectory, indicating a continued bullish trend in the short term.
However, the 200-day EMA at $28.65 was currently acting as a strong resistance level. If the price fails to rise above this level, a pullback could occur in the short term.
The MACD line confirmed a bullish edge as it was above the signal line at the time of writing.
The histogram was also in positive territory, but the recent red candles on the daily chart could lead to a temporary bearish crossover if sellers continue to apply pressure.
If AVAX can close above the $28.65 level (200-day EMA), the bulls may try to push the price towards the $31.3 resistance. A break above this level could set the stage for further gains towards $34-$36 in the coming days.
On the downside, if AVAX fails to hold above the 200-day EMA, the price could reach the $26.99 support level again, with the next major support at $25.62 (50-day EMA).
A sustained decline below this range could open doors to further decline towards $22-$20.
Derivatives data revealed this


Source: Coinglass
AVAX volume rose 36.82% over the past day. This increase in volume suggested increasing interest among traders, which could potentially signal a strong upcoming price move.
But the Open Interest fell by 3.38%, indicating that some traders have closed their positions. This difference between volume and open interest could imply uncertainty in the direction of the market.
Read Avalanche [AVAX] Price forecast 2024–2025
The overall long/short ratio was 0.9433, which slightly favored the sellers. However, the long/short ratio on Binance for top traders stood at 2.2206, indicating that major market buyers were betting on further price increases.
It’s worth noting that broader market sentiment and Bitcoin’s movement will also play a crucial role in determining AVAX’s trajectory in the near term.

