

- The current patterns in the total market capitalization (TOTAL) chart, particularly an ascending triangle, suggested that there is a major bullish trend on the horizon.
- This sentiment is reflected in the Total 3 chart, which analysts said was also poised for a rally.
From January to March, the total market capitalization of cryptocurrencies increased by approximately 81.36%, reaching $2.721 trillion. However, this figure has since fallen by 30.41%.
With the emergence of a bullish pattern, the cryptocurrency market is setting the stage for what could be the start of a substantial bull run.
An ascending triangle can lead to a rally, but with one condition
An ascending triangle is a technical trading pattern characterized by two converging diagonal lines meeting at a point, and is often a harbinger of potential rallies in the financial markets.
This pattern occurs when the price fluctuates between a horizontal resistance line and a rising support line, indicating a consolidation before a possible breakout.
In a bullish scenario, usually indicated by an ascending triangle, the price could eventually rise with a strong tendency to reach the previous high or push further into new territory.
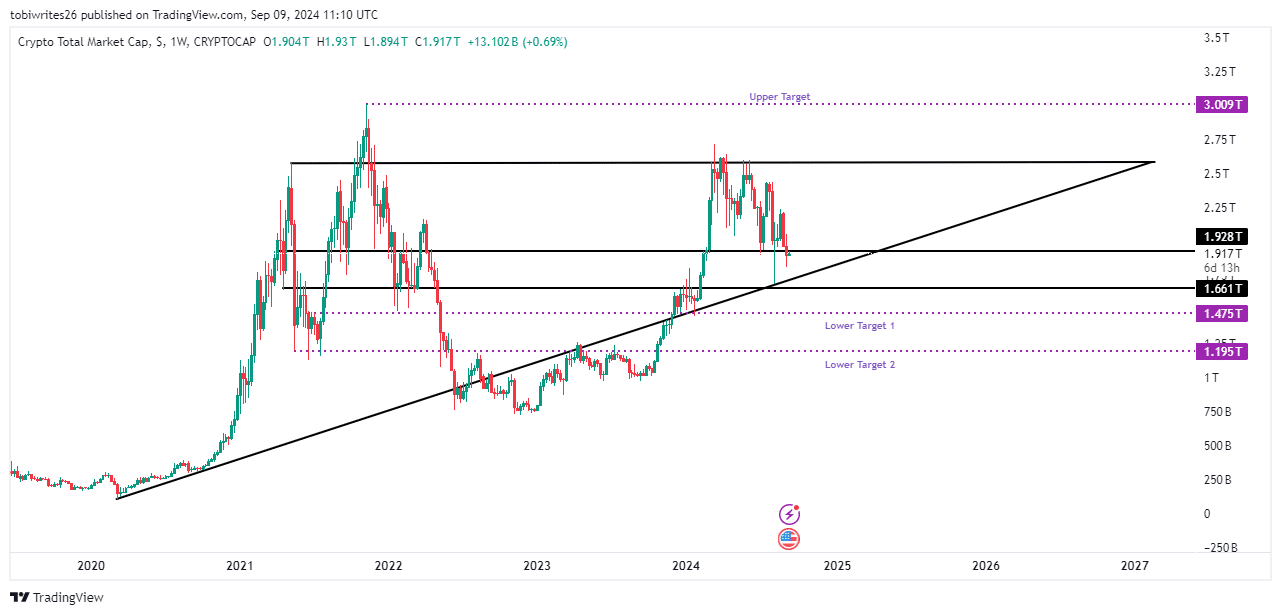
This has been observed with the TOTAL chart, which has consistently traded within similar patterns since 2020. At the time of writing, TOTAL was at a critical point with a support level of 1,928.
If this level holds, it could provide the necessary buying pressure for the crypto market to soar to new highs.
Moreover, another key support level exists at 1,661, which could become relevant if the 1,928 level is not maintained.
This lower level is important because it aligns with the bottom of the rising channel – a zone that has historically catalyzed upward moves in the market.
Source: trading view
If this buying pressure is maintained at 1.661, it could push the total cryptocurrency market cap back to its annual high of $3.009 trillion or potentially higher.
Conversely, if none of these support levels hold, the market could enter a recession, which could see the market cap drop to $1.475 trillion or even lower to $1.195 trillion.
Such a scenario would mean significant losses for Bitcoin and other cryptocurrencies and worsen market sentiment.
Optimism is on the rise
According to crypto analyst Mustache, altcoins are likely to see a big revival.
He has noted that altcoins are already reacting positively, and this is reinforced by two key technical signals that indicate a bullish trend.
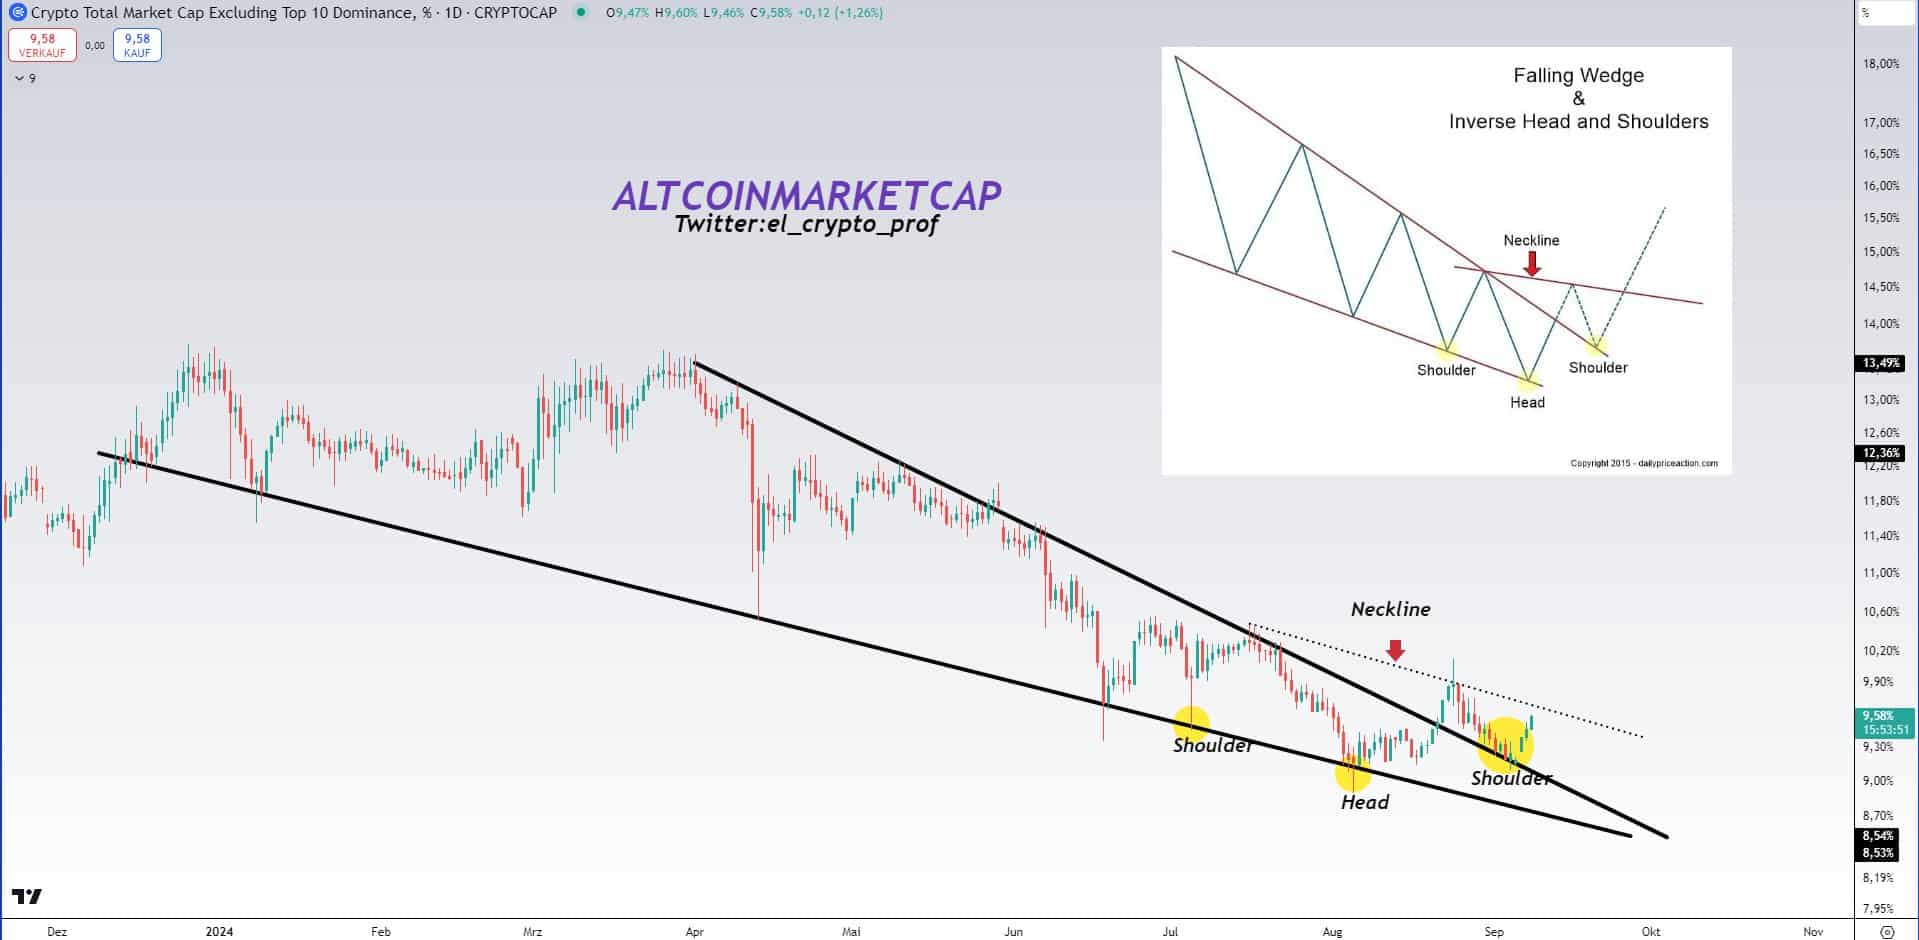
Mustache highlighted on Altcoin’s market cap chart that prices recently rose out of a nine-month bearish wedge pattern, marking the first indicator of an impending rally.
Source:
What contributes to the bullish momentum is the formation of an inverse head-and-shoulders pattern – a pattern traditionally seen as a strong predictor of upward price movements.
Such a significant breakout suggests that altcoins are about to rise and enter a phase commonly referred to as ‘altseason’, a period characterized by substantial gains against alternative cryptocurrencies.
Discussing the potential duration of this bullish phase, Mustache noted:
“I think we have some good weeks/months ahead of us.”
AMBCrypto has found Solana [SOL] as one of the cryptocurrencies likely to benefit significantly from this rally.
Solana could lead the next crypto wave
Solana has shown remarkable resilience in the volatile cryptocurrency market.
Despite a decline of 15.42% during the current month, indicating reduced interest rates, Solana has maintained its bullish momentum with an impressive rise of 566.98% over the past year.
This month’s decline appears to have been influenced by broader negative market trends, but Solana has still managed to avoid further losses.
Read Solana’s [SOL] Price forecast 2024–2025
Performance on daily and weekly terms remains relatively stable, with a small decline of 0.26% and a gain of 0.32% respectively.
Should the expected alternative season start, Solana is ready for an important rally. It is expected to break out of the current consolidation phase and possibly surpass the all-time high of $259.90, setting new all-time highs.