

- UNI has struggled to break out of a downtrend despite Uniswap’s $2 trillion volume milestone.
- Technical indicators point to a possible rebound, with rising open interest signaling market interest.
Uniswap [UNI] recently surpassed a staggering cumulative trading volume of $2 trillion on Ethereum’s Layer 1 blockchain, underscoring its significance in the decentralized finance ecosystem.
However, UNI, the protocol’s governance token, remains in a downward trend, which has raised concerns among investors. Uniswap is trading at $7.18, down 4.61% at the time of writing, and faces a tough road to recovery.
The key question now is whether this milestone can create enough momentum to reverse Uniswap’s bearish trajectory.
Key support and resistance levels for UNI
The UNI price chart shows critical support and resistance levels that can determine the near future. The primary support level is around $6.39, a key area to stop further declines if sellers continue to apply pressure.
However, if UNI stays above this level, it could attract and stabilize buyers.
Furthermore, Uniswap is facing significant resistance at $8.31, a level it must break to confirm a recovery. A more ambitious target is at $11.67, which could indicate strong market confidence if achieved.
Therefore, these levels are essential for investors looking for signs of a trend reversal.
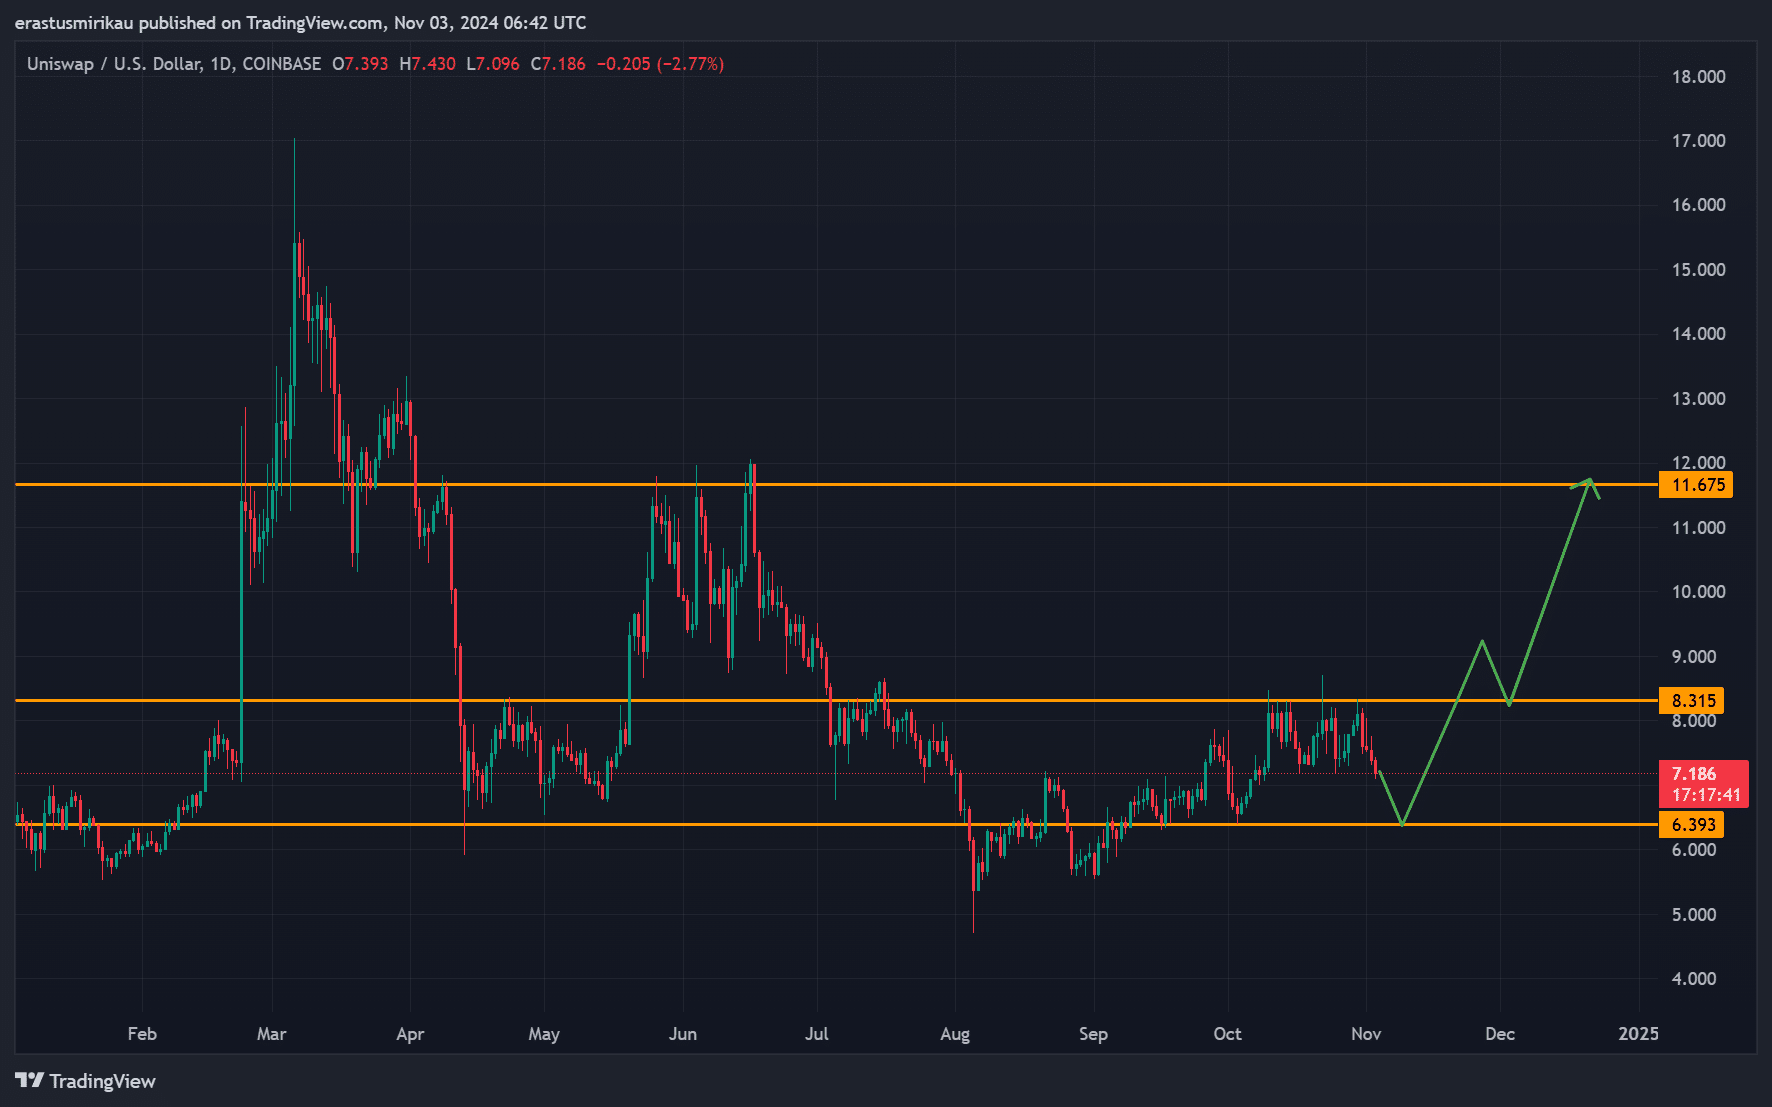
Source: TradingView
Analysis of the number of transactions: does the activity indicate growth?
Uniswap’s number of transactions has reached 1,838,000, up 0.8% in the past 24 hours. Although modest, this rebound signals consistent trading activity, which could support UNI’s price.
Higher transaction volumes often correlate with greater liquidity, which could stabilize prices. As a result, observing whether transaction growth continues will be key in assessing whether Uniswap can regain momentum in the near term.
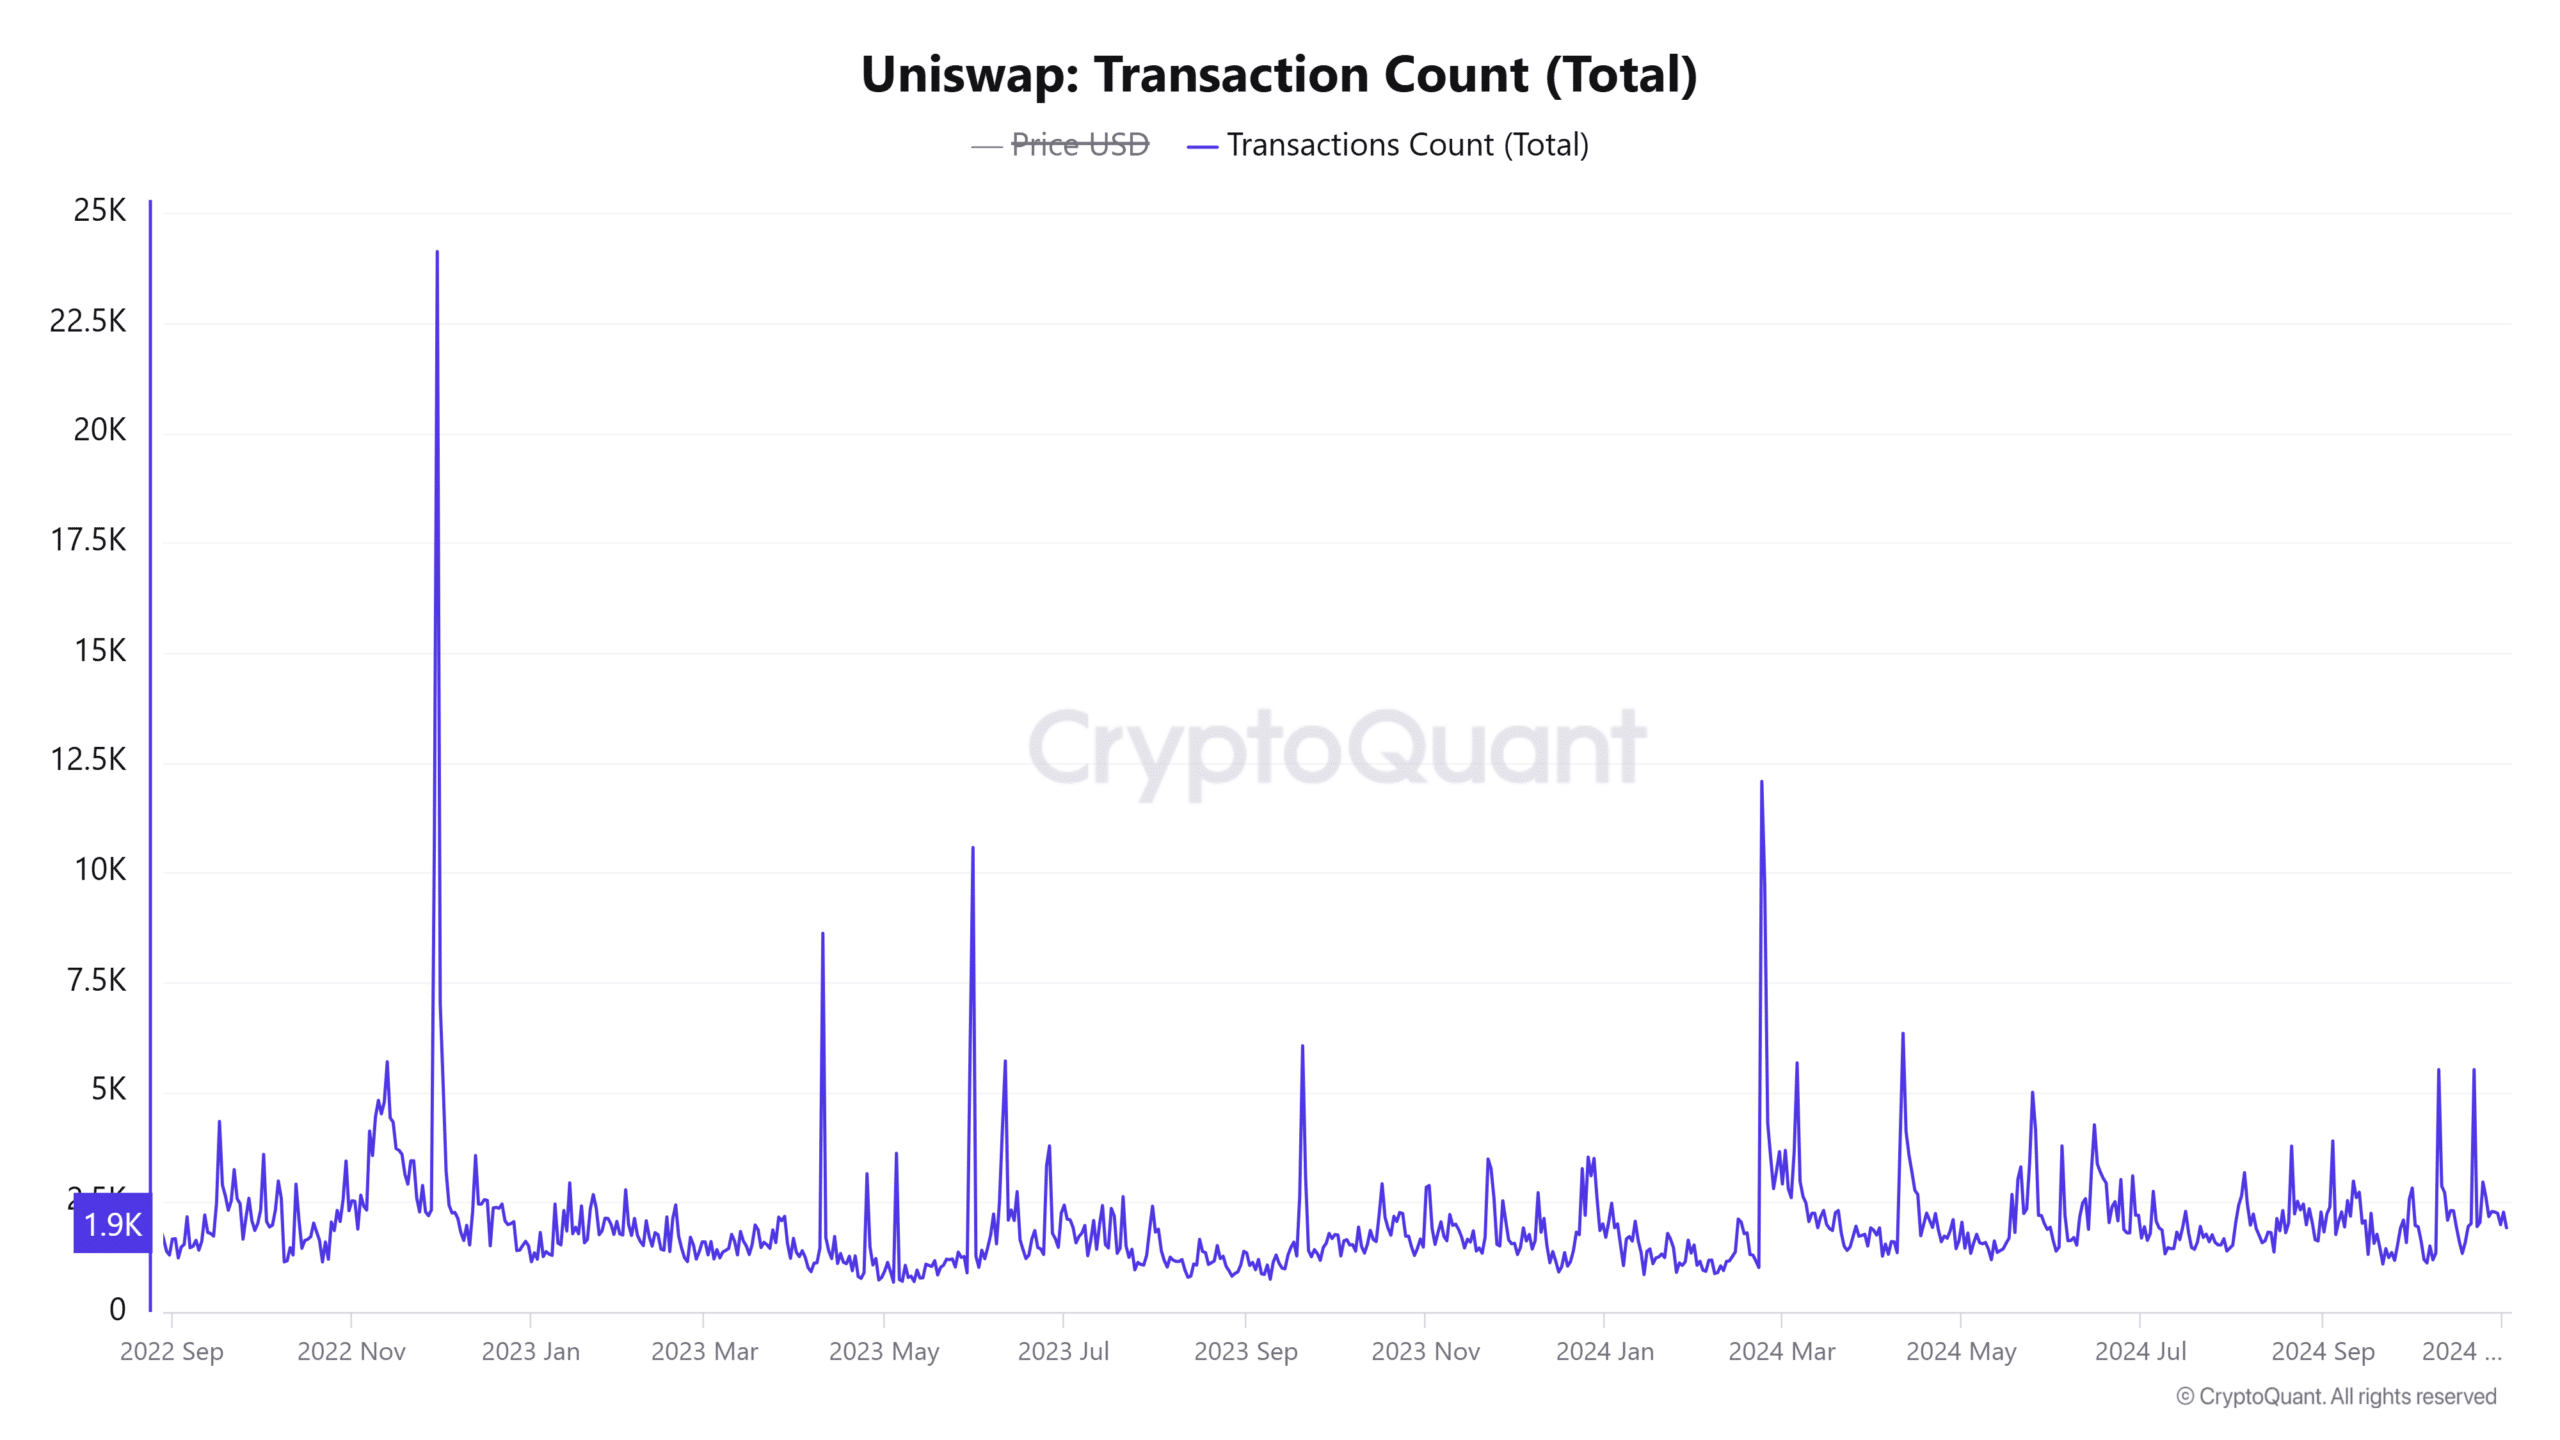
Source: CryptoQuant
Technical Indicators: Do Bollinger Bands and RSI Signal a Reversal?
Analyzing UNI’s technical indicators, specifically the Bollinger Bands and RSI, provides insight into potential price movements.
UNI is currently trading near the lower bound of the Bollinger Bands, indicating a potentially oversold region. This could lead to a rebound if buying interest returns.
Meanwhile, the Relative Strength Index (RSI) stands at 44.14, which, while not oversold, suggests downward pressure. Therefore, if UNI fails to break past $8.31, a rebound may not have enough momentum for a sustainable recovery.
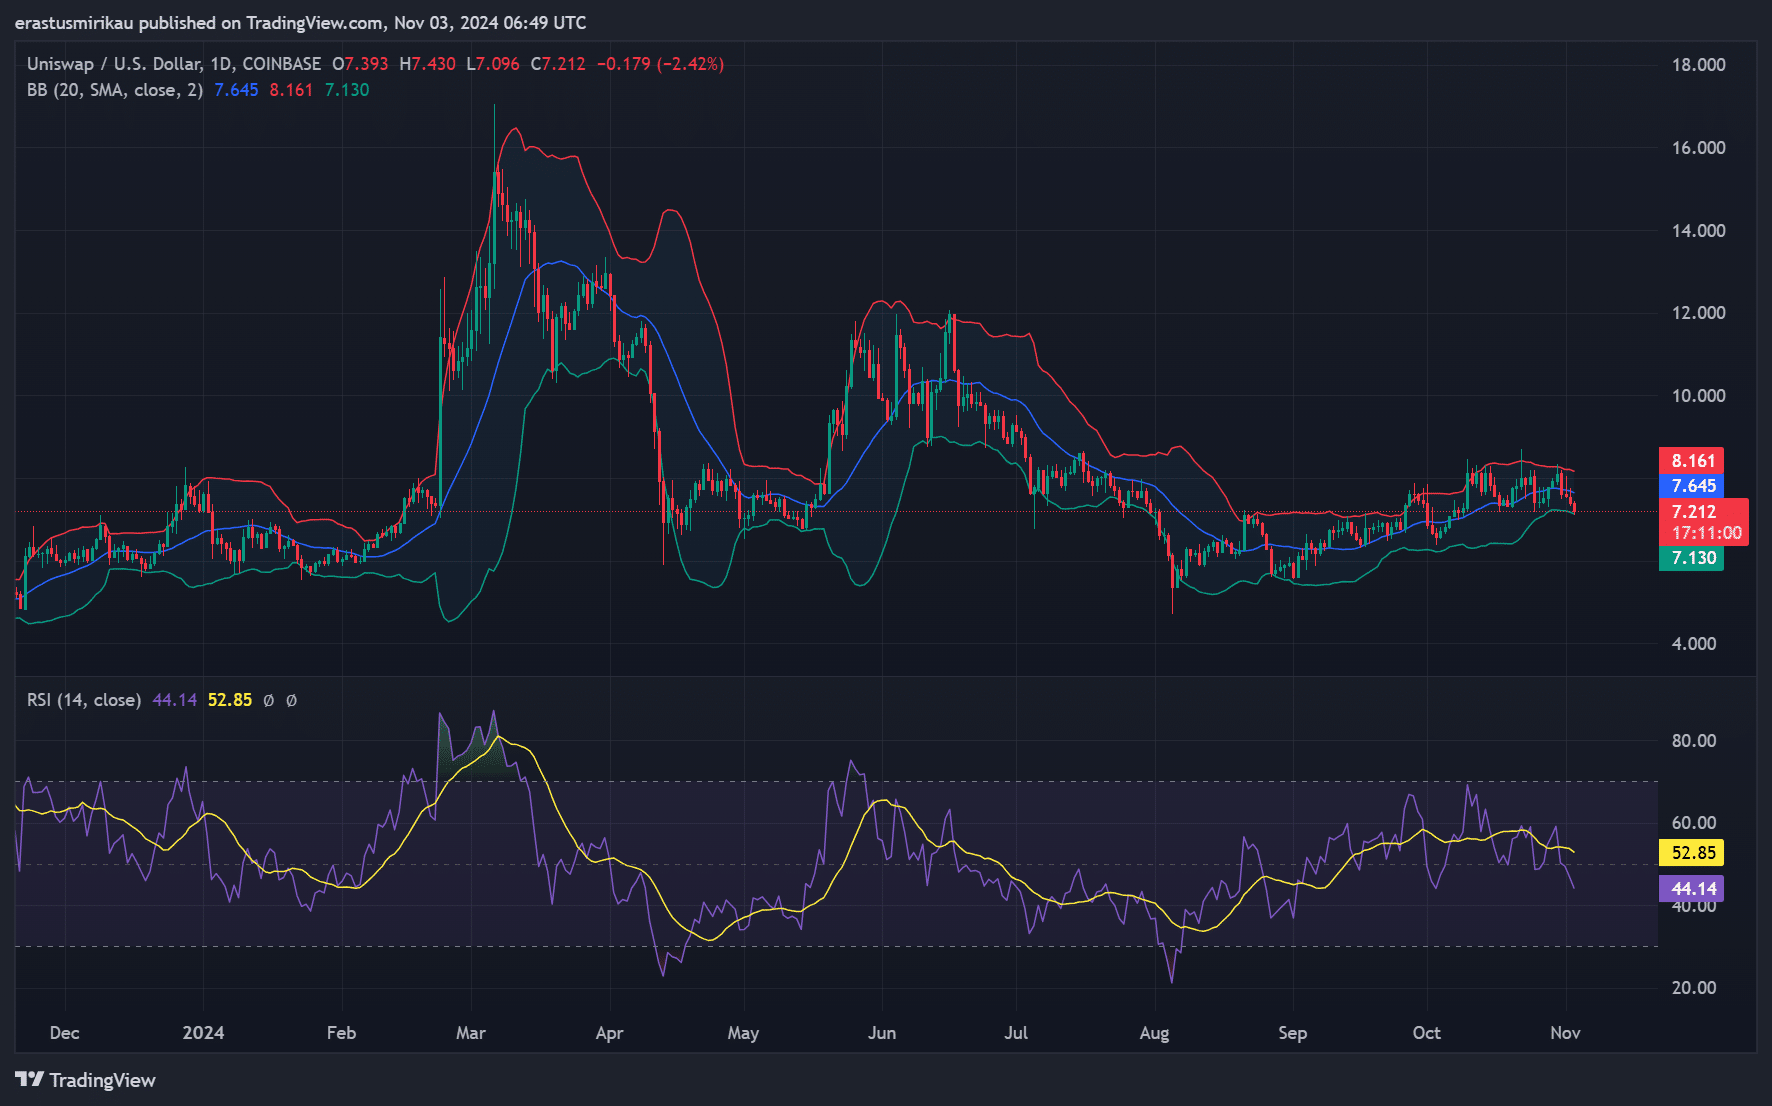
Source: TradingView
UNI Market Sentiment: What Does Rising Open Interest Mean?
Market sentiment shows an increase in open interest, up 6.79% to $114.83 million, indicating growing merchant engagement. This increase indicates anticipation of a possible price shift.
If UNI maintains this sentiment alongside volume growth, it could strengthen its chances of recovery.
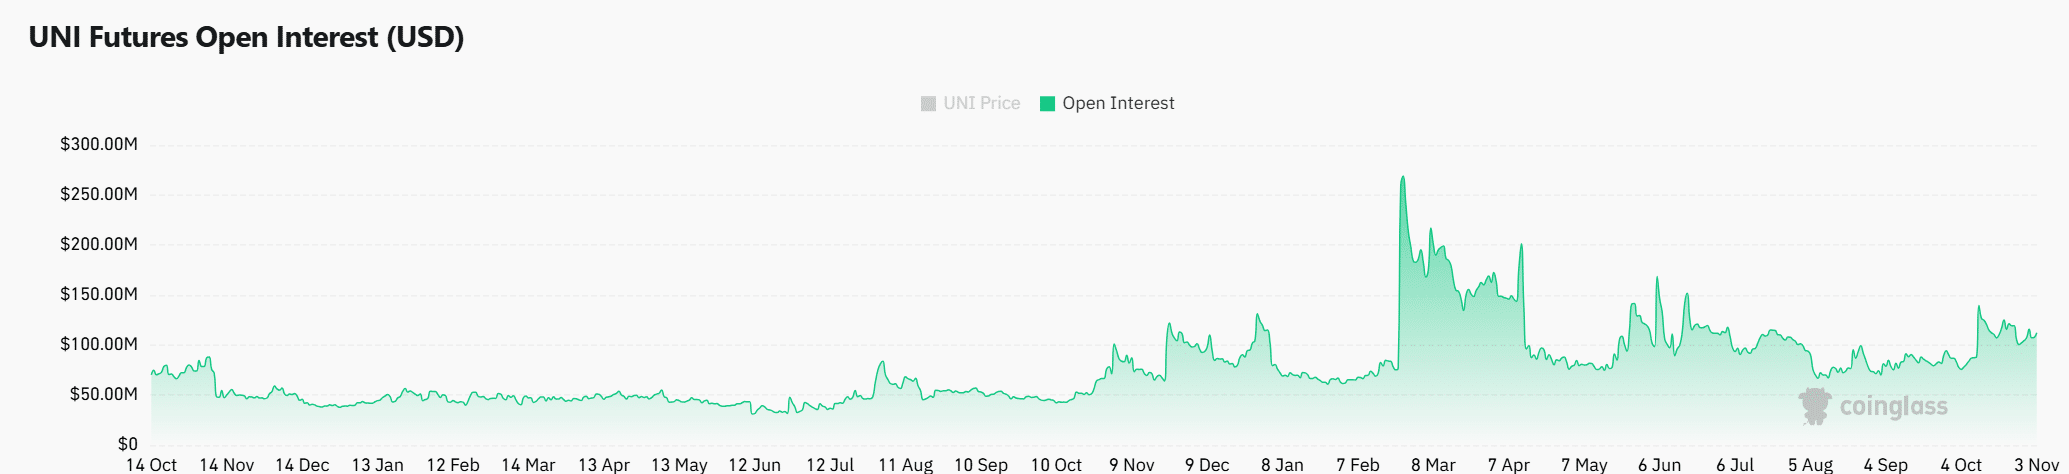
Source: Coinglass
Is your portfolio green? View the UNI Profit Calculator
While Uniswap’s $2 trillion milestone underlines its strength, UNI’s recovery depends on breaking through resistance and attracting more buyer interest.
Transaction growth and market sentiment will be crucial to monitor in the coming weeks.