

- Bitcoin has had a bearish structure on the weekly and three-day price charts.
- Technical indicators were mixed, but overall prices are more likely to fall than rise.
Bitcoin [BTC] roared back to life after visiting the liquidity pool in the $64k zone. The price decline reversed within a few hours and the $69,000 liquidity zone was the next short-term target.
So far, BTC is on track to achieve this.
In a message on X (formerly Twitter), InTheBlok noted that there was a strong net flow of BTC to exchanges. This could trigger a sell-off and signals a price reversal in the coming days.
The bearish market structure highlights trader bias
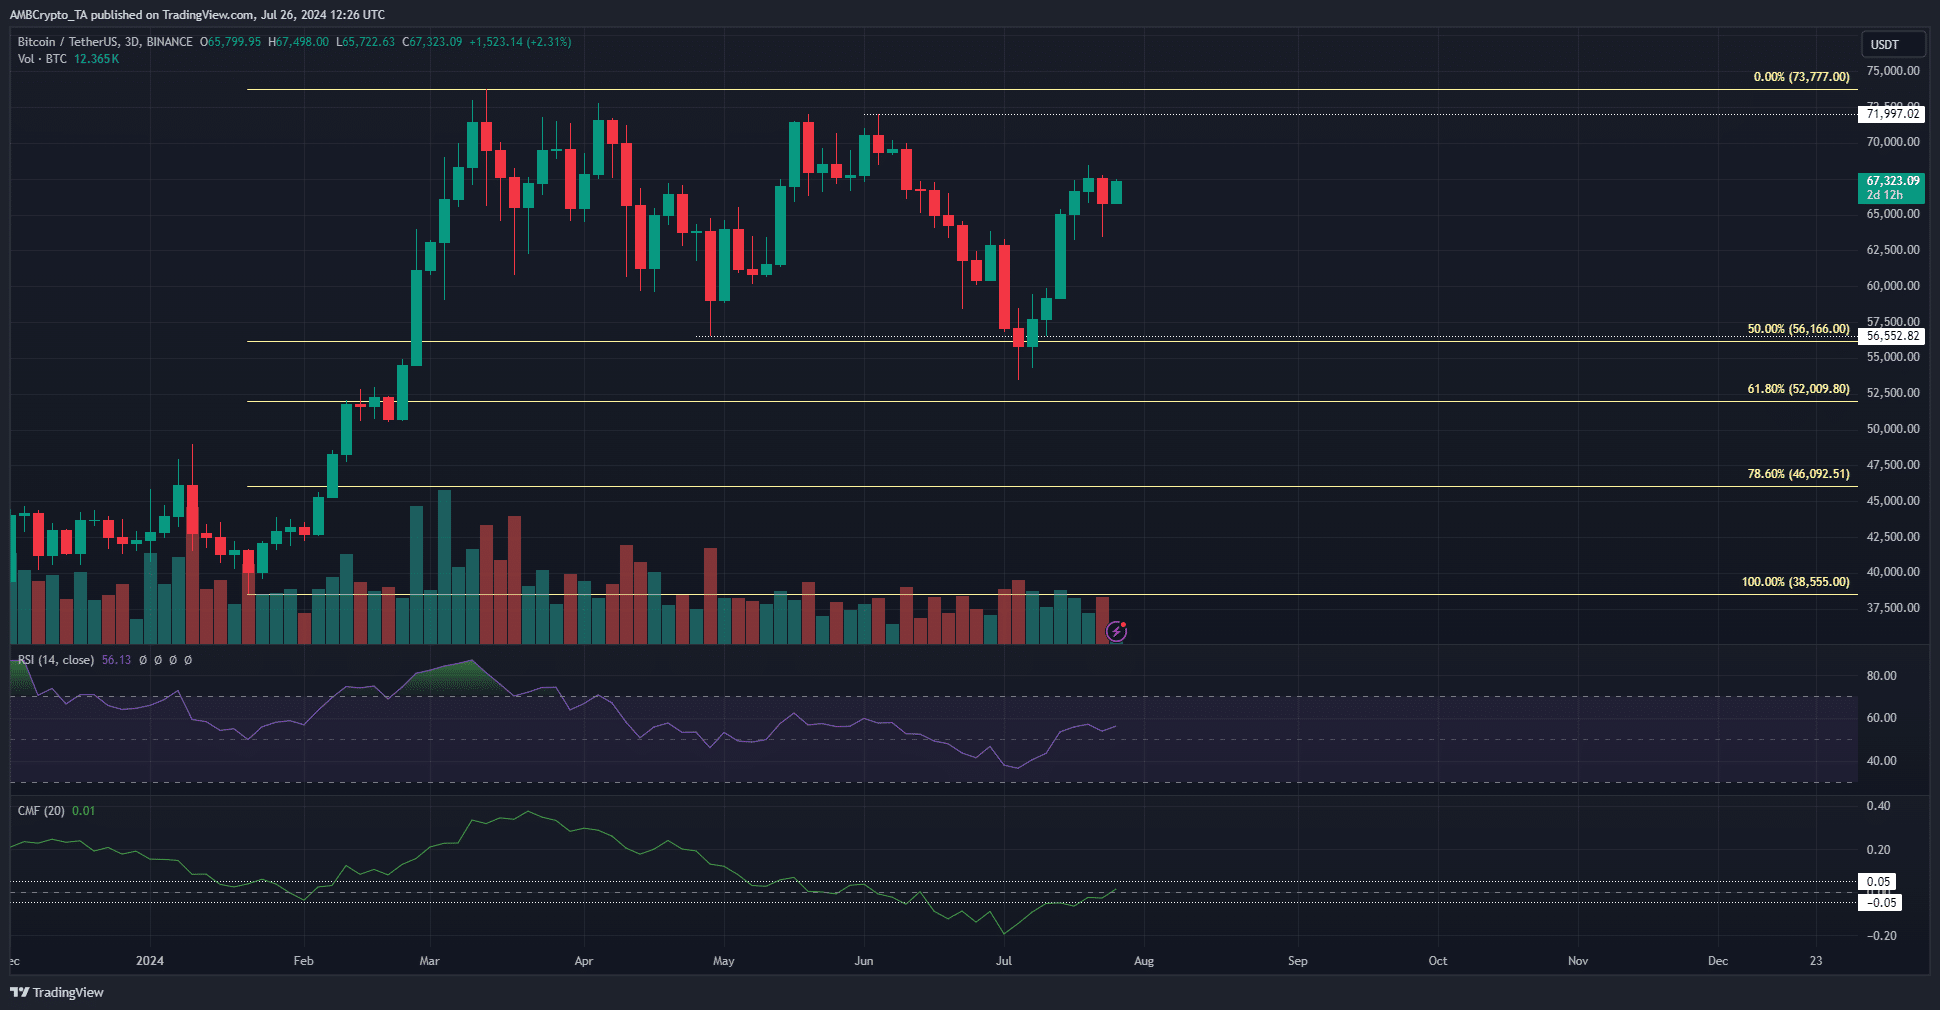
Source: BTC/USDT on TradingView
On the 3-day price chart, a session closed below $56.5k on July 5, marking a bearish structure break. The previous lower high of $72k remained unbeaten.
Based on previous analysis, the $69k liquidity pool is a place where a bearish reversal could occur soon.
The RSI on the 3-day chart stood at 56, but did not show strong bullish momentum. It hinted that momentum could shift bullishly. However, the CMF stood at +0.01 and does not reflect strong capital inflows.
Overall, the bias has been bearish on the 3-day chart, but this could change if the $72k level is broken.
BTC speculators were eager to go long
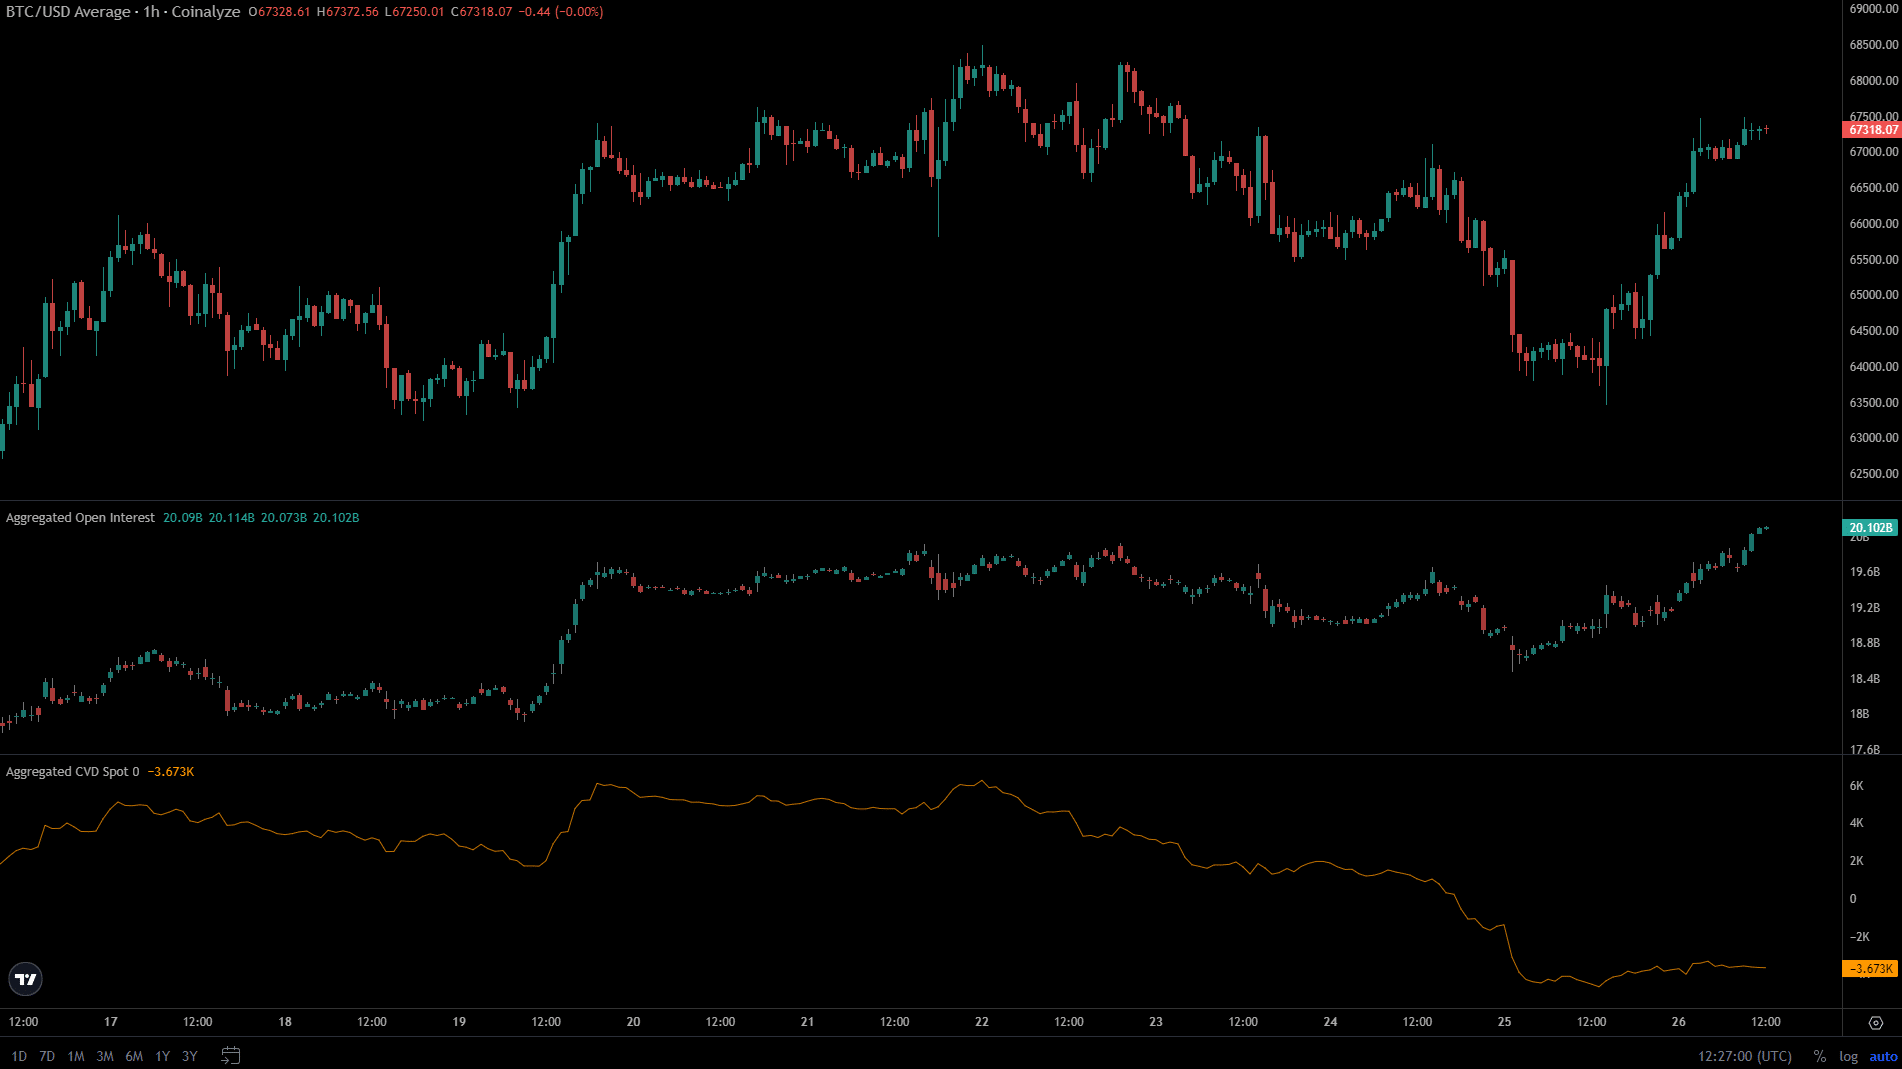
Over the past 24 hours, the $64,000 price turn has been accompanied by a sharp increase in Open Interest. It indicated strong bullish sentiment in the short term and a sign of conviction among speculators of more gains.
On the other hand, the spot CVD was unable to establish an uptrend. This indicated a lack of buying pressure despite the price increase and reinforced the idea of a bearish reversal.
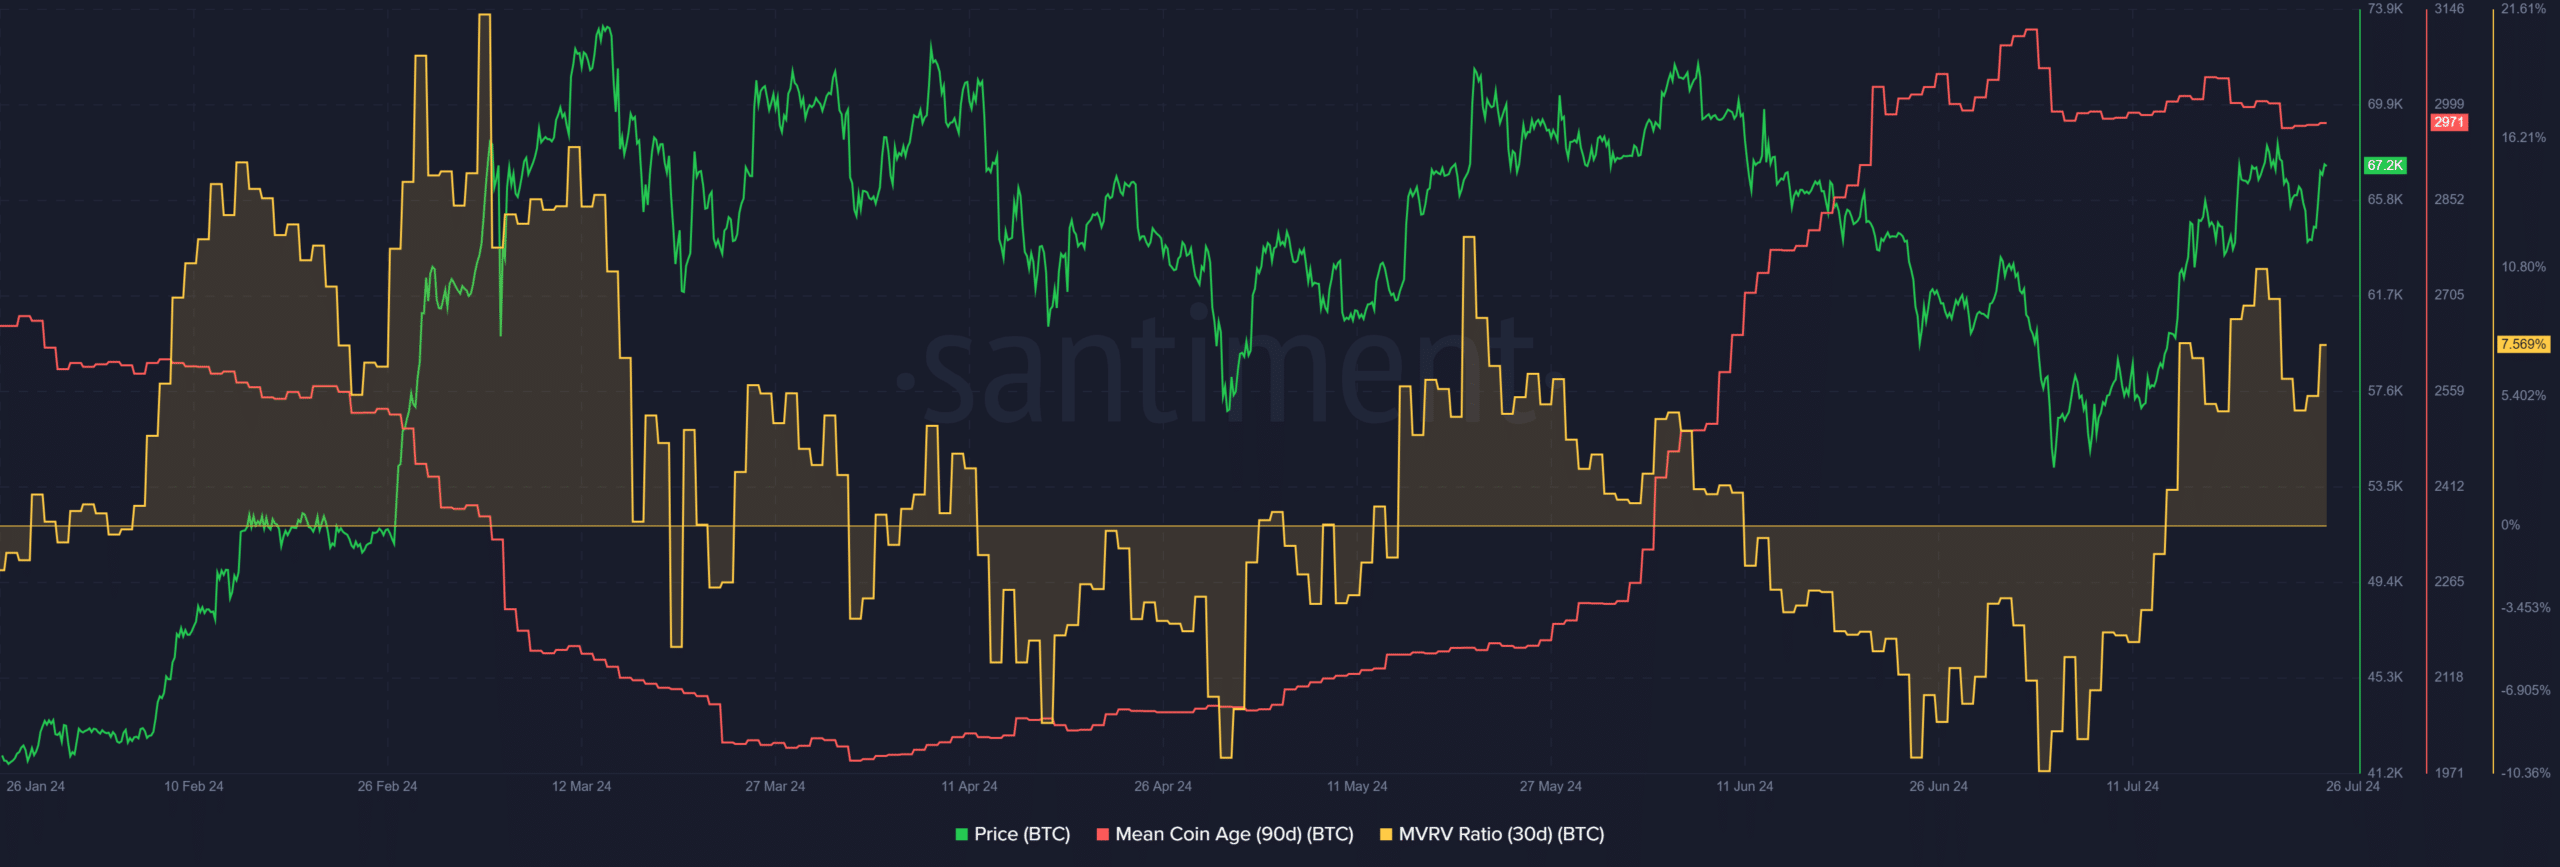
The 30-day MVRV was 7.6%, showing that short-term holders made modest gains. A sustained increase in the MVRV would signal potential selling pressure in the form of profit-taking by short-term holders.
The average coin age (MCA) of 90 days is not showing a downward trend despite the price decline. It was a sign that holders were unwilling to part with their BTC, indicating a continued bullish trend.
Read Bitcoin’s [BTC] Price forecast 2024-25
Putting all the clues together, it seemed likely that Bitcoin would see a reversal around the $69,000 zone. If the MCA starts to fall, it would reinforce this idea.
If the MCA and spot CVD move back up, it would instead be an indication that the BTC bulls were strong enough to push prices past the $69,000 liquidity pool.
Disclaimer: The information presented does not constitute financial, investment, trading or other advice and is solely the opinion of the author.