

- Historically, Bitcoin’s bearish cross precedes significant price increases.
- Current market indicators pointed to possible short-term volatility followed by a potential uptrend.
The cryptocurrency market now seems to be seeing Bitcoin [BTC] struggling to establish a consistent upward trajectory.
Despite hitting a high of nearly $62,000 and a low of around $56,000 over the past two weeks, Bitcoin’s price swings have left investors questioning its next move.
At the time of writing, the cryptocurrency was trading at around $58,550, reflecting a small increase of 0.7% over the past day, swinging between a 24-hour high of $59,833 and a low of $57,812.
Bitcoin: Indicators of a Possible Downturn
Amid this uncertain market behavior, a notable pattern has emerged that could indicate future price movements.
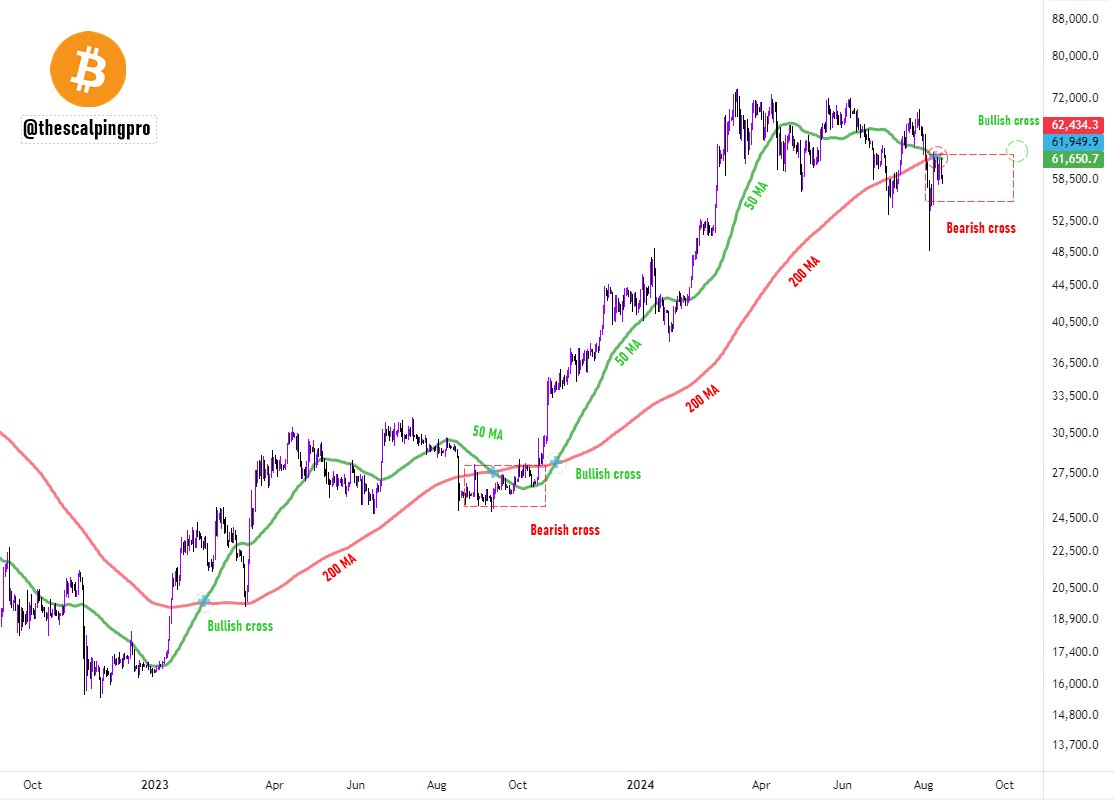
Bitcoin has formed a so-called ‘bearish cross’ on the daily chart, a technical indicator that could indicate an impending decline.
Source: Mags on X
This term refers to the event where the 50-day Simple Moving Average (SMA), currently at $61,749, falls below its 200-day SMA, which is at $62,485.
This configuration, often seen as a signal of short-term market weakness, was just that pointed out by the pseudonymous trader Mags on the social media platform X (formerly Twitter).
Although the formation of this pattern on the chart sounds downright negative, that is not necessarily the case now.
Mags pointed out that the formation of this bearish cross pattern on BTC’s chart has historically been followed by significant rallies.
For example, after a bearish cross in September 2023, Bitcoin’s price rose by about 50% within four months. Similarly, after a cross in July 2021, the price rose 54% in the same time frame.
Mags suggests that if this pattern holds true, Bitcoin could experience another period of fluctuating prices before potentially regaining its moving averages and initiating a bullish cross, leading to another strong rally.
The underlying foundations
Despite the focus on chart patterns, it’s worth considering Bitcoin’s fundamental metrics, which provide insight into broader market attitudes and investor behavior.
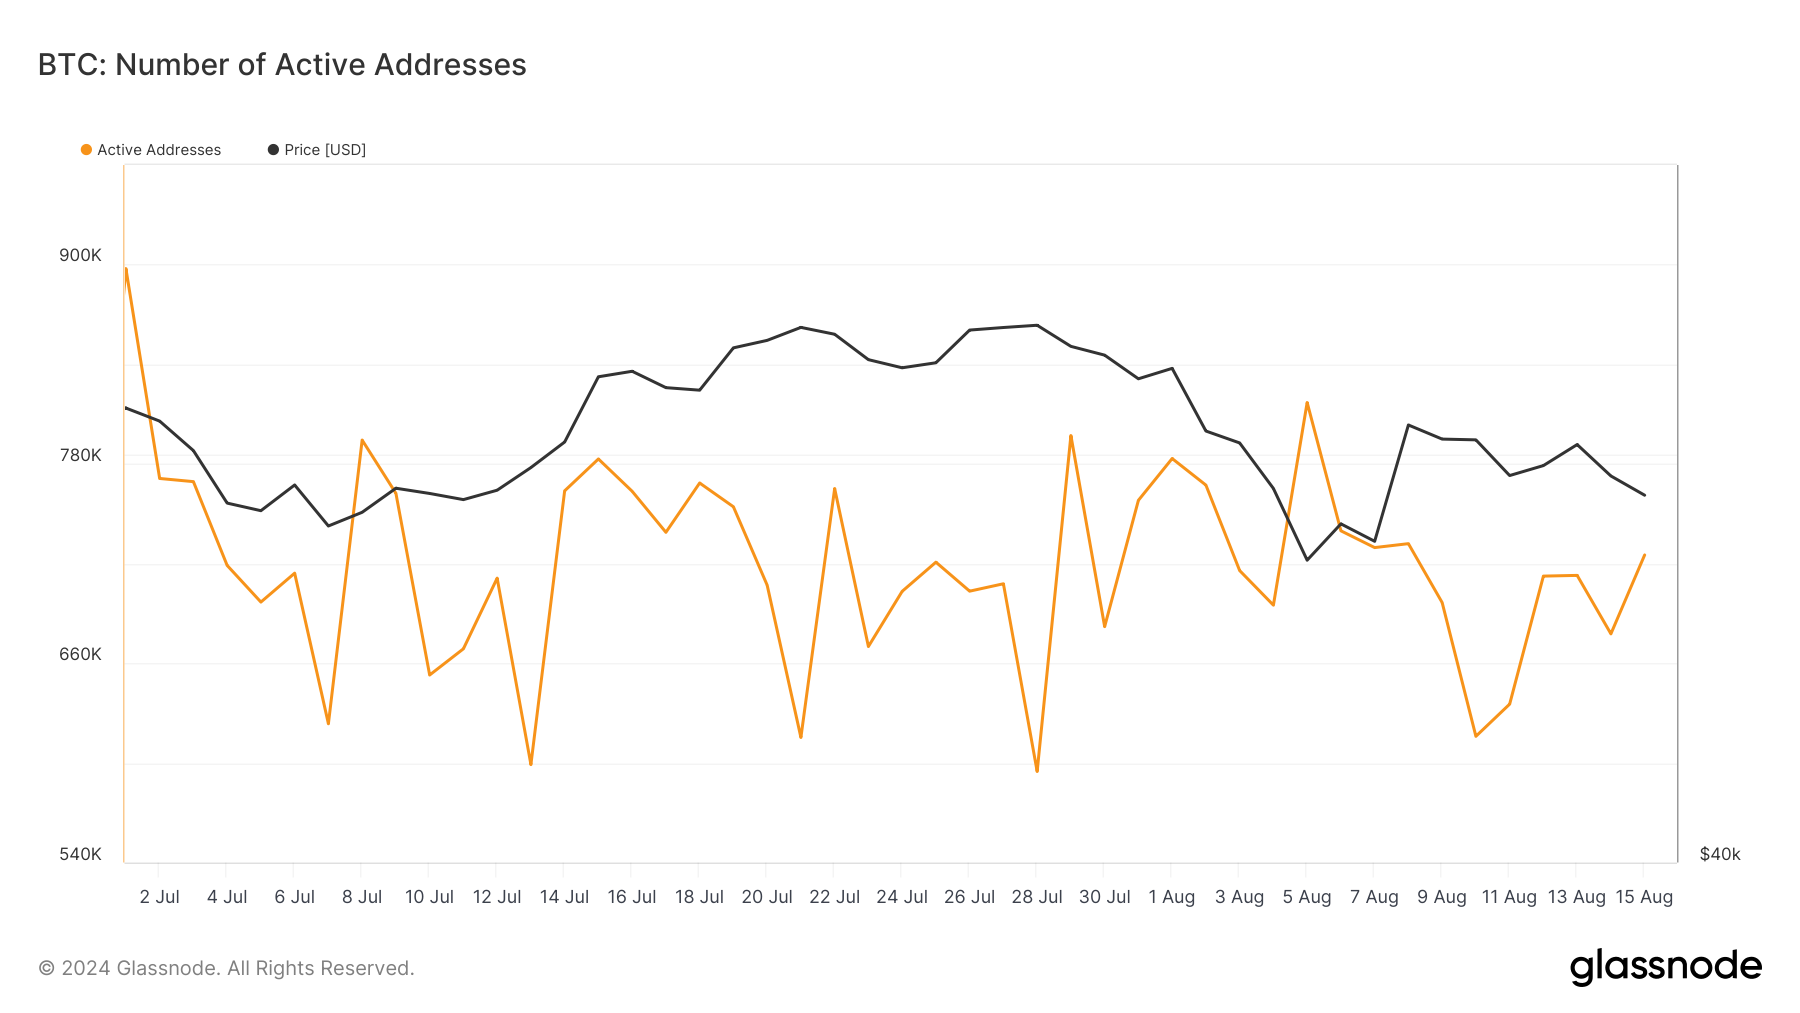
Recently facts from Glassnode showed that the number of active Bitcoin addresses dropped significantly from 897,000 in early July to 615,000 in mid-August.
Source: Glassnode
However, there has recently been an increase to over 725,000 addresses, which amounts to an increase of approximately 17.89%.
This increase in the number of active addresses could indicate growing engagement within the Bitcoin network, potentially signaling a positive shift in market sentiment.
Is your portfolio green? Check out the BTC profit calculator
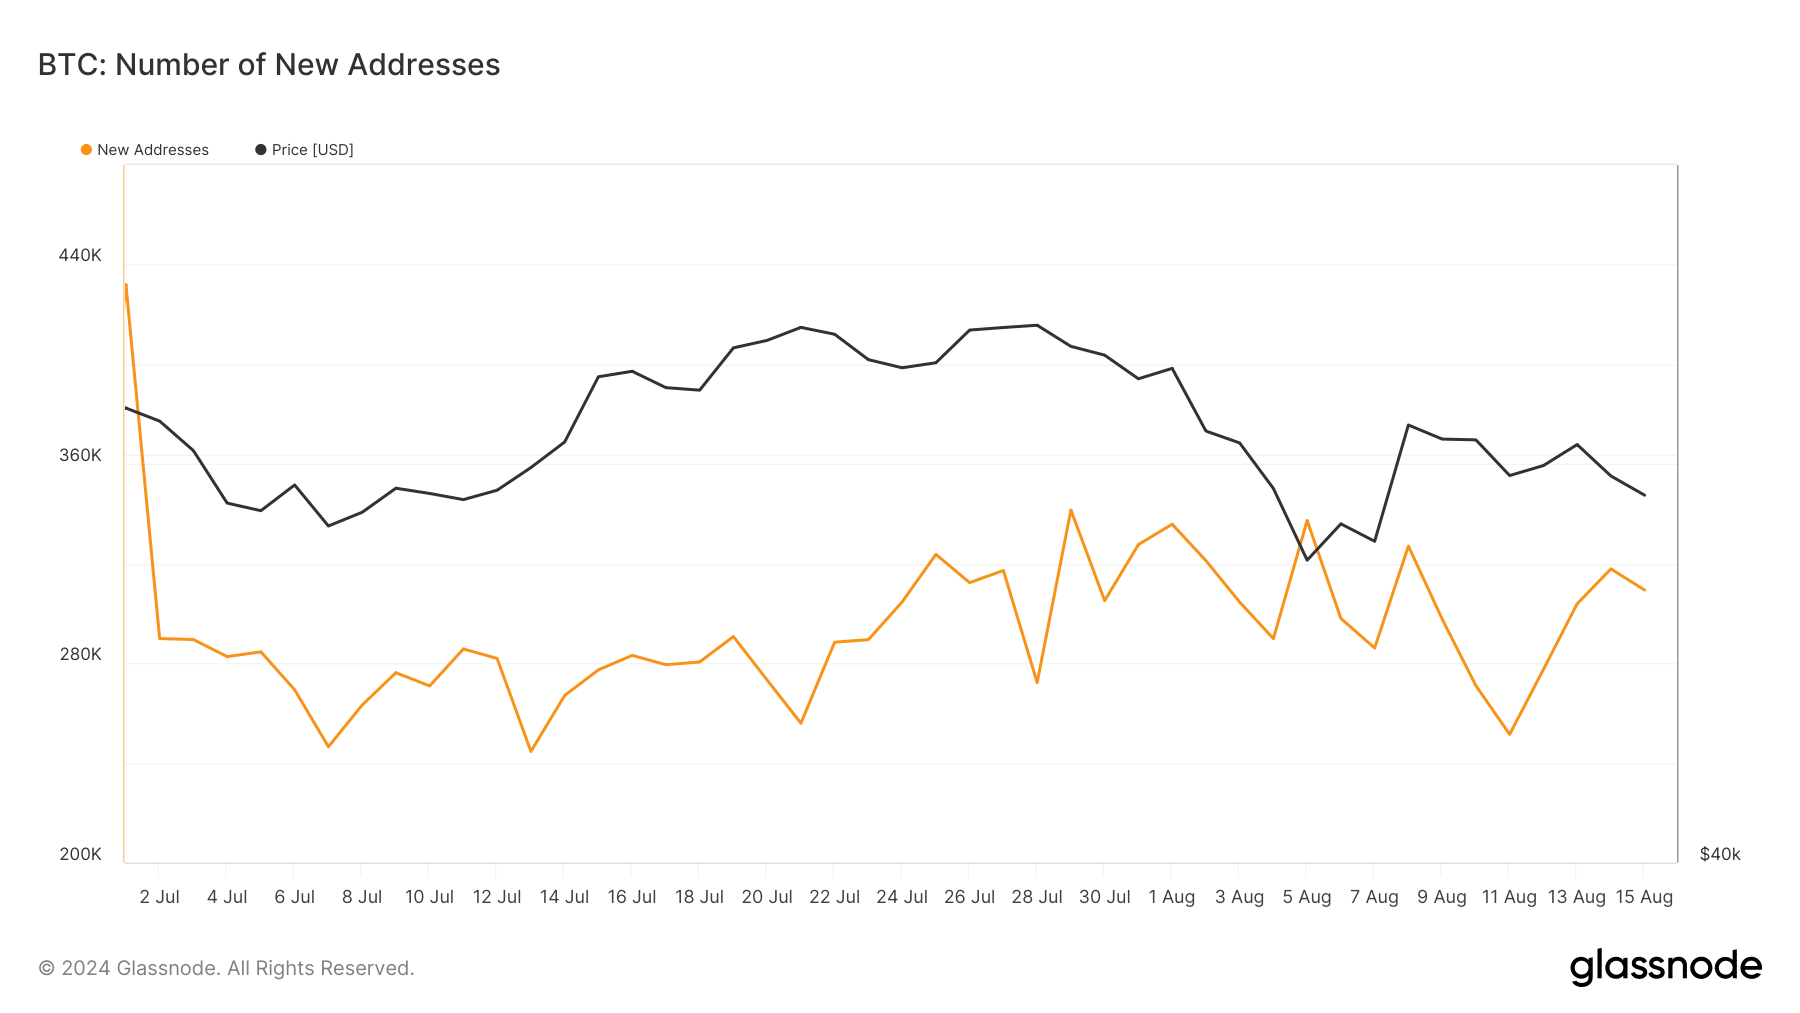
Additionally, the number of new Bitcoin addresses, an indicator of new investor interest, has also increased shown signs of recovery.
After falling to 251,000 in early August, there has been a surge to over 300,000 new addresses, indicating renewed interest and possibly more capital inflows into Bitcoin.
Source: Glassnode