

Dogecoin (DOGE) is trying to base itself on higher timeframes as Cantonese Cat points to a possible inverse head-and-shoulders relationship in the daily market, with the price falling just below a defined resistance plateau while the demand zone remains nearby.
Dogecoin Breakout could target $0.19
In a daily chart (DOGE/USD, Binance) shared via
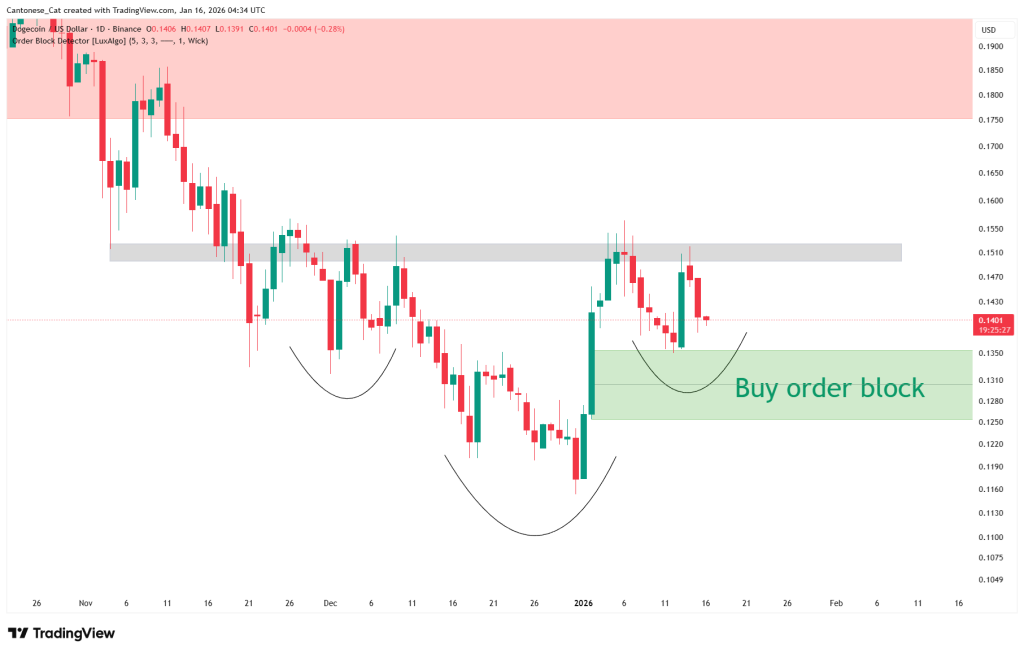
The main feature of that daily view is a highlighted ‘Buy Order Block’ of approximately $0.1250 to $0.1350. Price is shown retreating to the top of that block after failing to sustain the most recent push higher, placing the current trading location in a classic ‘right shoulder area’ if the pattern is to remain constructive.
Above the current spot price, the chart marks a horizontal gray resistance band (“the shoulder”) at approximately $0.149–$0.152. This is the area that DOGE needs to reclaim for the inverse H&S thesis to transition from “shaping” to “triggering,” as it has functioned as a utility in recent testing.
Related reading
Using Cantonese Cat’s daily inverse head-and-shoulders chart, the measured movement is the neckline minus the head low, projected upward from the neckline: the neckline is the gray supply band centered around $0.151 (label on the axis), while the head prints at around $0.116. That puts a high around $0.035, implying a pattern target near $0.186.
Notably, this target extends directly into the red supply zone above the chart, which starts around $0.175 and extends towards $0.19, making that area the first obvious region where a confirmed breakout is expected to encounter significant resistance.
DOGE 2-Day Bollinger Bands Signal Momentum
In particular, the Bollinger Bands on the 2-day chart support the bullish thesis in the medium term. Cantonese Cat highlighted on Tuesday that DOGE is trading above the Bollinger base around $0.1343, while the upper band is near $0.1526 and the lower band is near $0.1160.
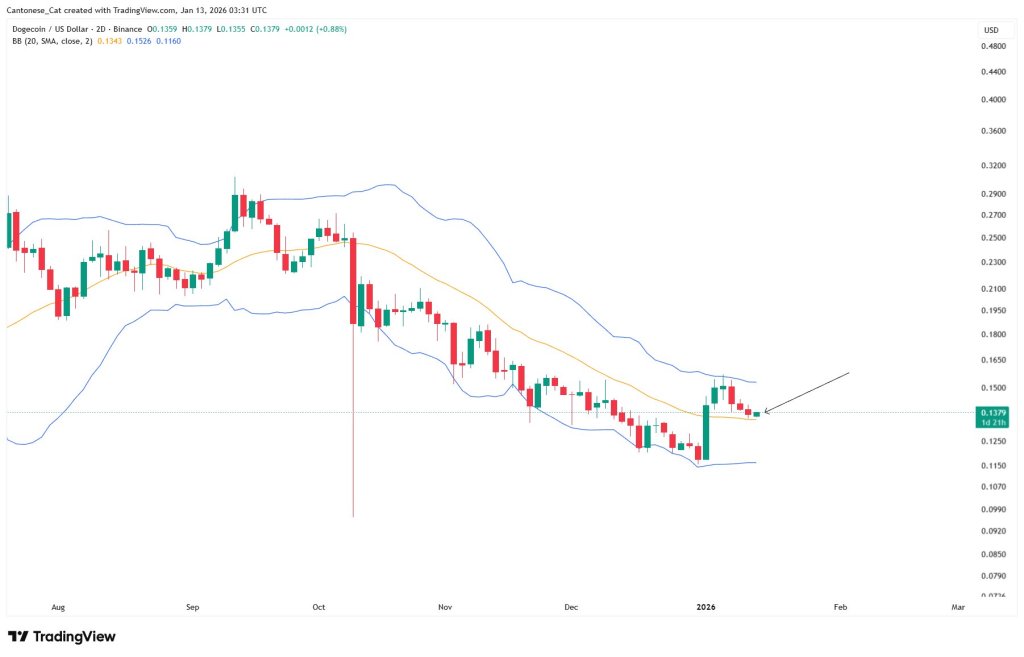
Cantonese Cat summed up the idea succinctly: “Price wants to hang out in the upper part of the Bollinger band? Do we have a chance here?” In practice, the frame of the “top part” matters because it is a momentum narrative. After a prolonged decline, persistent closes above the base and in the upper half of the bands can signal that sellers are no longer controlling the volatility profile, even before the price clears the obvious horizontal resistance.
Related reading
That said, the 2D view also makes the immediate problem clear: the upper band is close to the same zone that is marked as resistance on a daily basis. In other words, the bullish thesis is not just “holding support,” but “proving” it with acceptance above the $0.15–$0.152 region.
If DOGE continues to defend the $0.1250–$0.1350 buying block and reclaims the $0.149–$0.152 supply band, the inverse head-and-shoulders thesis gains credence. The next areas that the chart itself highlights are the higher supply zones around $0.175 and the higher $0.18 region, where previous selling pressure was visible.
If the price loses the buy order block, the reading pattern weakens significantly. In that case, the Bollinger structure on the 2D chart points attention back to the lower band area near $0.1160 and the late December lows.
At the time of writing, DOGE was trading at $0.139.
Featured image created with DALL.E, chart from TradingView.com