

Bitcoin’s crash last weekend has reached the $60,000 level back in the market conversationbut crypto analyst Merlijn The Trader believes the real opportunity may come at a lower price. Technical analysis comparing the current Bitcoin structure to Wyckoff’s 2022 accumulation phase shows that buying the current bounce would be a costly mistake as the real accumulation window hasn’t even opened yet.
Bitcoin’s Wyckoff setup points under $60,000
To understand where Merlijn The Trader thinks Bitcoin is going, it helps to understand where it has gone. Merlin’s analysis is built all around the Wyckoff accumulation model, using Bitcoin’s 2022 bottom structure as a reference point.
In that cycle, Bitcoin rallied around $15,500 before recovering in the $23,000 region, where eager buyers rushed in, believing the worst was over. However, that was not the case. The price action then triggered a secondary selling wave that crushed late buyers before the real markup phase began.
Related reading
The analyst believes that the structure for 2026 is develop in a similar way. His chart shows that Bitcoin is currently trading around the same phase where the market previously moved at a sign of strength, lost momentum and later entered the spring phase. The important message is that any bounce from the current region may not be a point at which traders should become aggressive in their purchases.
Another important message from the analysis is that the $60,000 level can be misleading. Bitcoin fell below that level during the recent sell-off, and it is important as support because it is close the 200-week moving average.
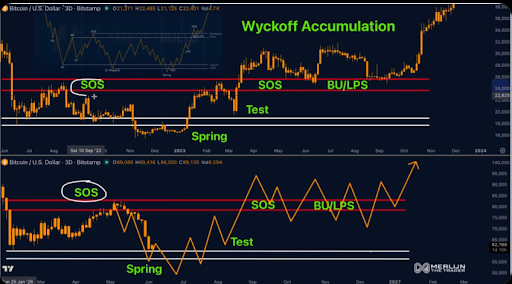
Bitcoin price chart. Source: @MerlijnTrader On X
The DCA zone that could matter most
Merlin’s Wyckoff setup identifies five phases: Phase A stops the downtrend via a selling climax, Phase B builds the case as institutions accumulate within the range, Phase C delivers the spring, which is a final shakeout below support, Phase D marks within the range with a final support point and a sign of strength, and Phase E is the breakout and uptrend.
Related reading
Merlijn’s chart places Bitcoin within this structure in 2026, with the spring phase still ahead. The analyst’s projection is that a spring to $50,000 is comingfollowed by a bounce rally to the $65,000-$70,000 range. That rebound, he warns, will once again attract bulls who will jump into what looks like a recovery, the same trap that caught investors in 2023.
Merlin places Bitcoin’s dollar cost average zone between $48,000 and $59,000. This range is the part of the graph where he expects the better long-term results to appear. Therefore, patience is required, and the conclusion is that the best time to start buying Bitcoin may come when fear is strongest in the $48,000 to $59,000 range, and not when fear is at its highest. produces its first jump back above $70,000.
At the time of writing, Bitcoin is trading at $62,891.