- The sentiment index of 69 indicates optimism, but caution is advised
- Historical patterns pointed to correction risks near market highs
As the market enters 2025, investor sentiment is at a peak, fueled by growing optimism and a renewed sense of opportunity. While enthusiasm is growing, it remains well below the extreme levels seen during previous market booms. Nevertheless, experts warn of the risk of a correction, especially in Bitcoin [BTC] and other major cryptos, is increasing as the market continues to gain momentum.
With this in mind, it is crucial that investors remain vigilant, keep a close eye on key indicators and be alert to early signals that could indicate a shift in market dynamics.
Fear and Greed Index – What Happens at 95?


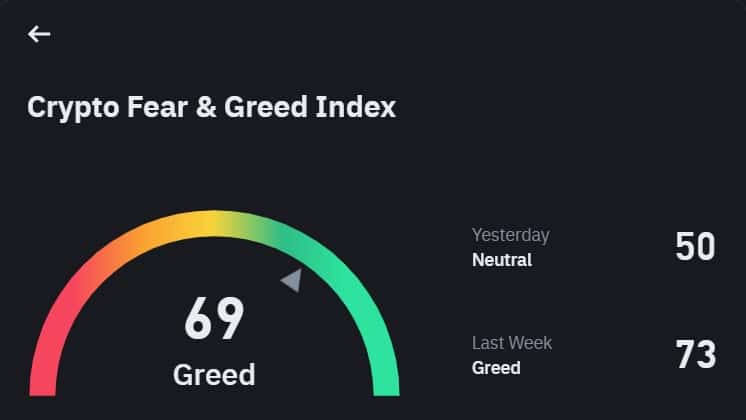
Source: Binance Square
At the time of writing, the index stood at 69 – a strong sign of optimism, but still far from the red zone. Analysts believe that when the index hits 95, the market typically enters an overheating phase, characterized by speculative excesses and euphoria. Historically, this threshold has served as a warning signal, indicating that a correction or downturn could be imminent.
Such levels often precede changes in investor behavior, as cautious optimism gives way to unsustainable exuberance.
Key indicators to watch for a possible correction
As the market approaches overheated conditions, Adler noted several key indicators that could provide early warnings of a correction.
Sale of long-term holders
Historically, increased selling activity from long-term holders has signaled the onset of market corrections. December 2024 saw a slight increase in LTH profit-taking, echoing patterns observed before the 2021 and 2017 market peaks. A sharp increase in these sales could signal that sophisticated investors are pulling back ahead of a potential downturn, undermining market confidence.
BTC ETF outflows
After record inflows in late 2024, Bitcoin ETFs experienced modest outflows in early January 2025. This decline could indicate cooling sentiment among institutional investors – often a harbinger of reduced buying pressure.
MicroStrategy Stock Moves
As a gauge of institutional Bitcoin sentiment, MSTR stock serves as an important proxy. Any continued decline in stock performance, especially after strong demand in Q4 2024, could reflect waning interest in Bitcoin exposure among institutional investors. Such moves have previously coincided with market corrections.
Read Bitcoin’s [BTC] Price forecast 2025-26
Bitcoin – Historical Patterns and Price Analysis


Source:
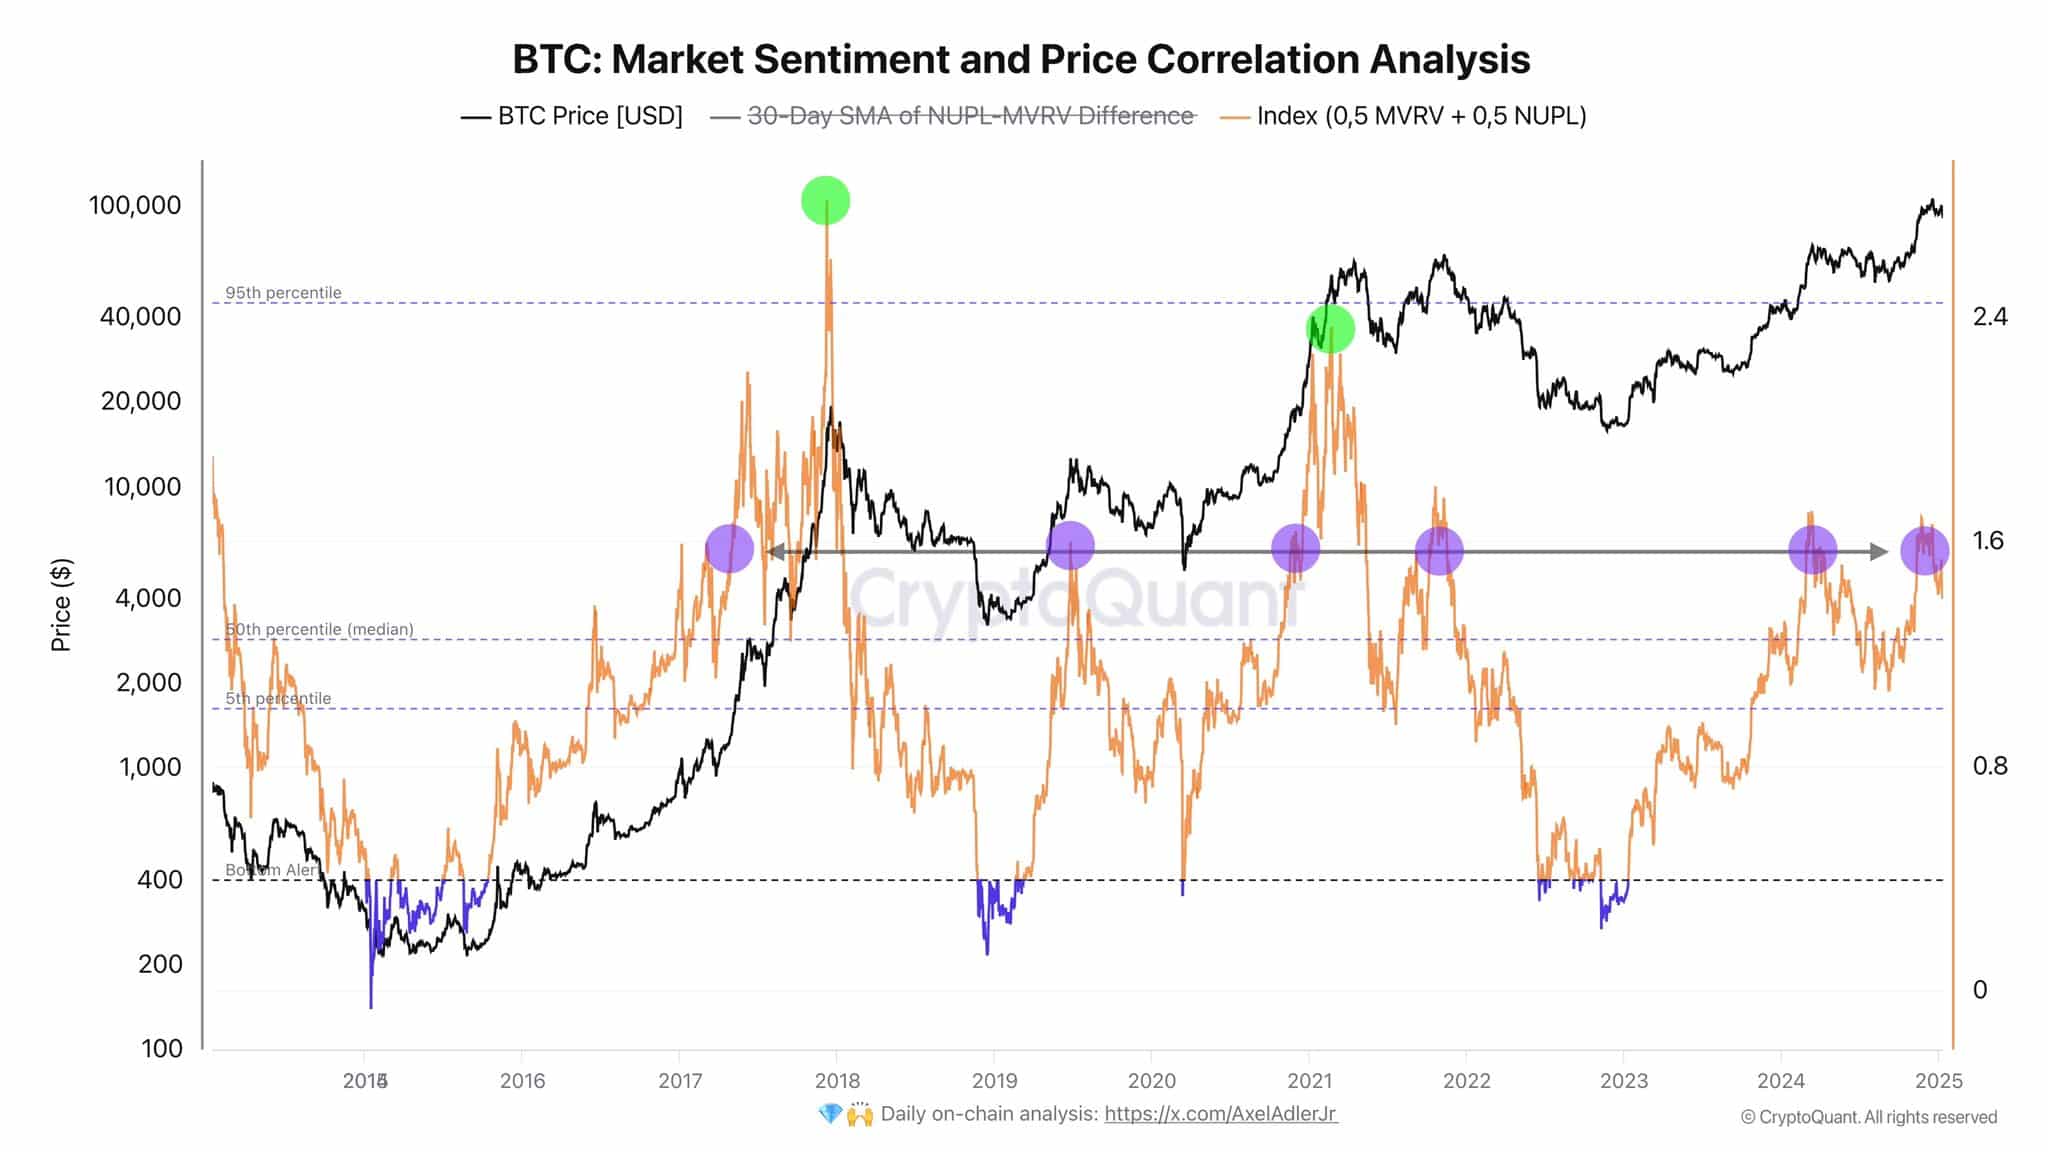
The correlation between sentiment and price has historically been a reliable predictor of market cycles. At the time of writing, the NUPL-MVRV index appeared to be approaching the levels that previously indicated market peaks in 2017, 2021 and mid-2024.
These thresholds mark zones of increased risk, where corrections often follow overheated conditions.


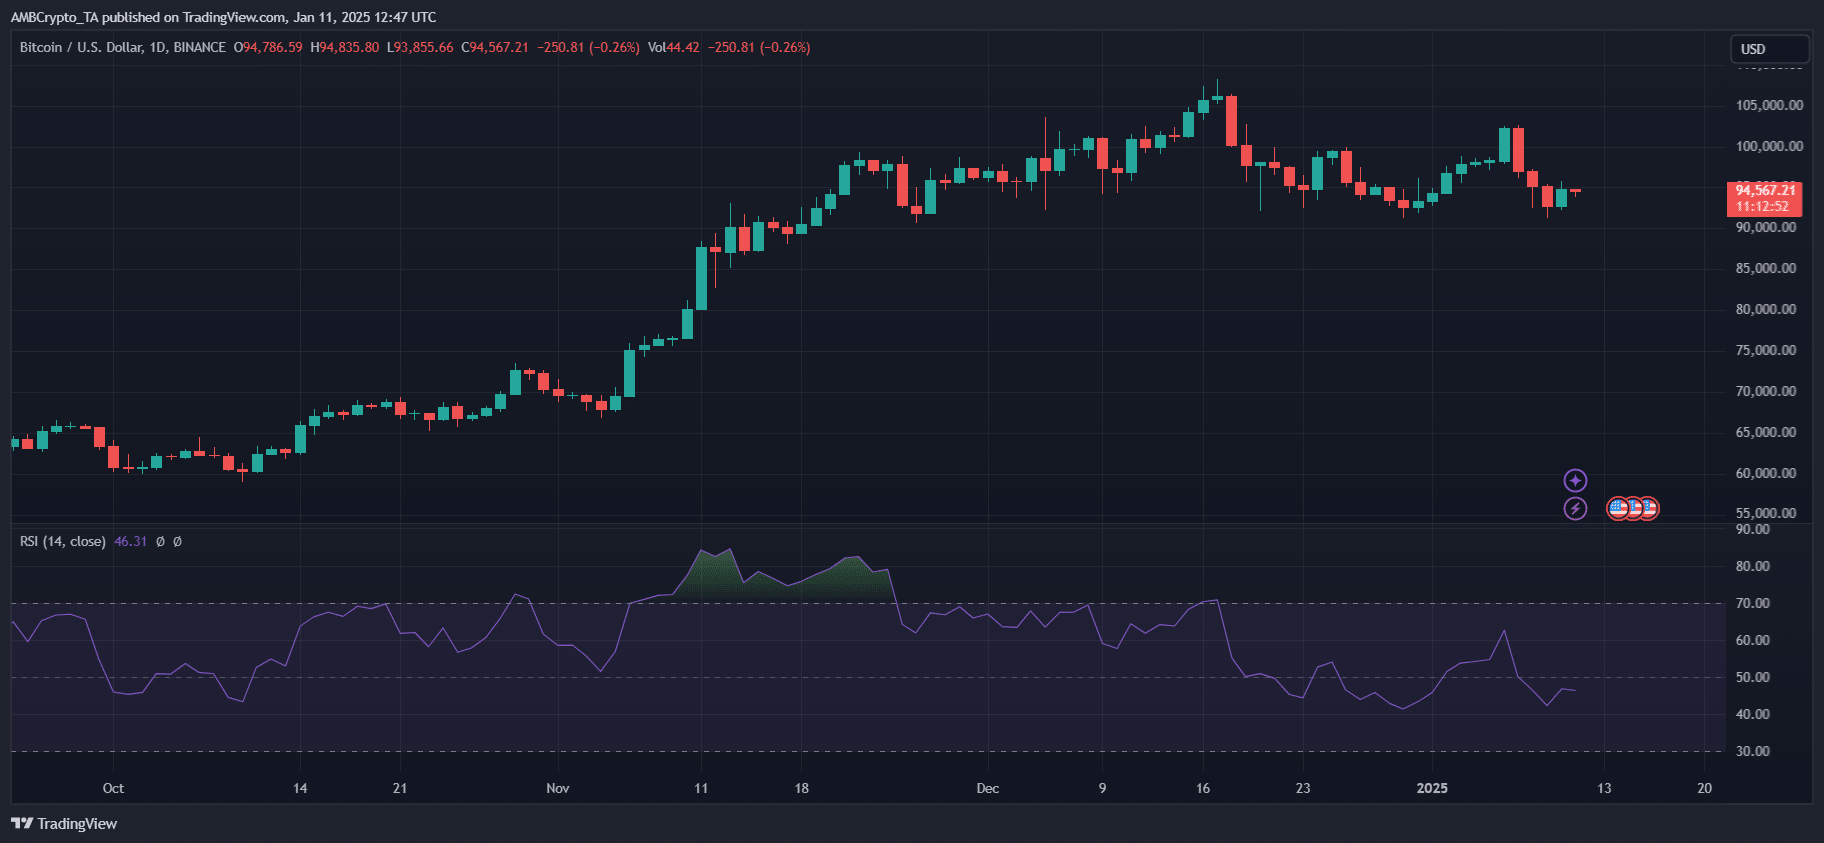
Source: TradingView
Similarly, Bitcoin’s RSI cooled to 46 on the daily chart after December’s overbought highs, signaling a possible shift toward consolidation or decline.
The price action around $95,000 reflects a critical resistance zone, as previous parabolic runs stalled after similar RSI declines. If momentum is not regained here, it could pave the way for a retracement to support levels around $88,000-$90,000, in line with broader profit-taking and declining ETF inflows.


