- HBAR forms a bullish pennant with $0.31 as key resistance for a possible breakout.
- Rising open interest and steady development activity are reinforcing HBAR’s bullish momentum.
Hedera [HBAR] continues to capture the market’s attention as price action suggests a strong bullish breakout is in the offing.
The technical patterns of the coin, which is trading at $0.2715, up 4.98% at the time of writing, indicate that early 2025 could be crucial for the price trajectory. That’s why traders are increasingly analyzing whether HBAR can maintain its momentum.
HBAR Chart Analysis – Setting the Stage for a Breakout
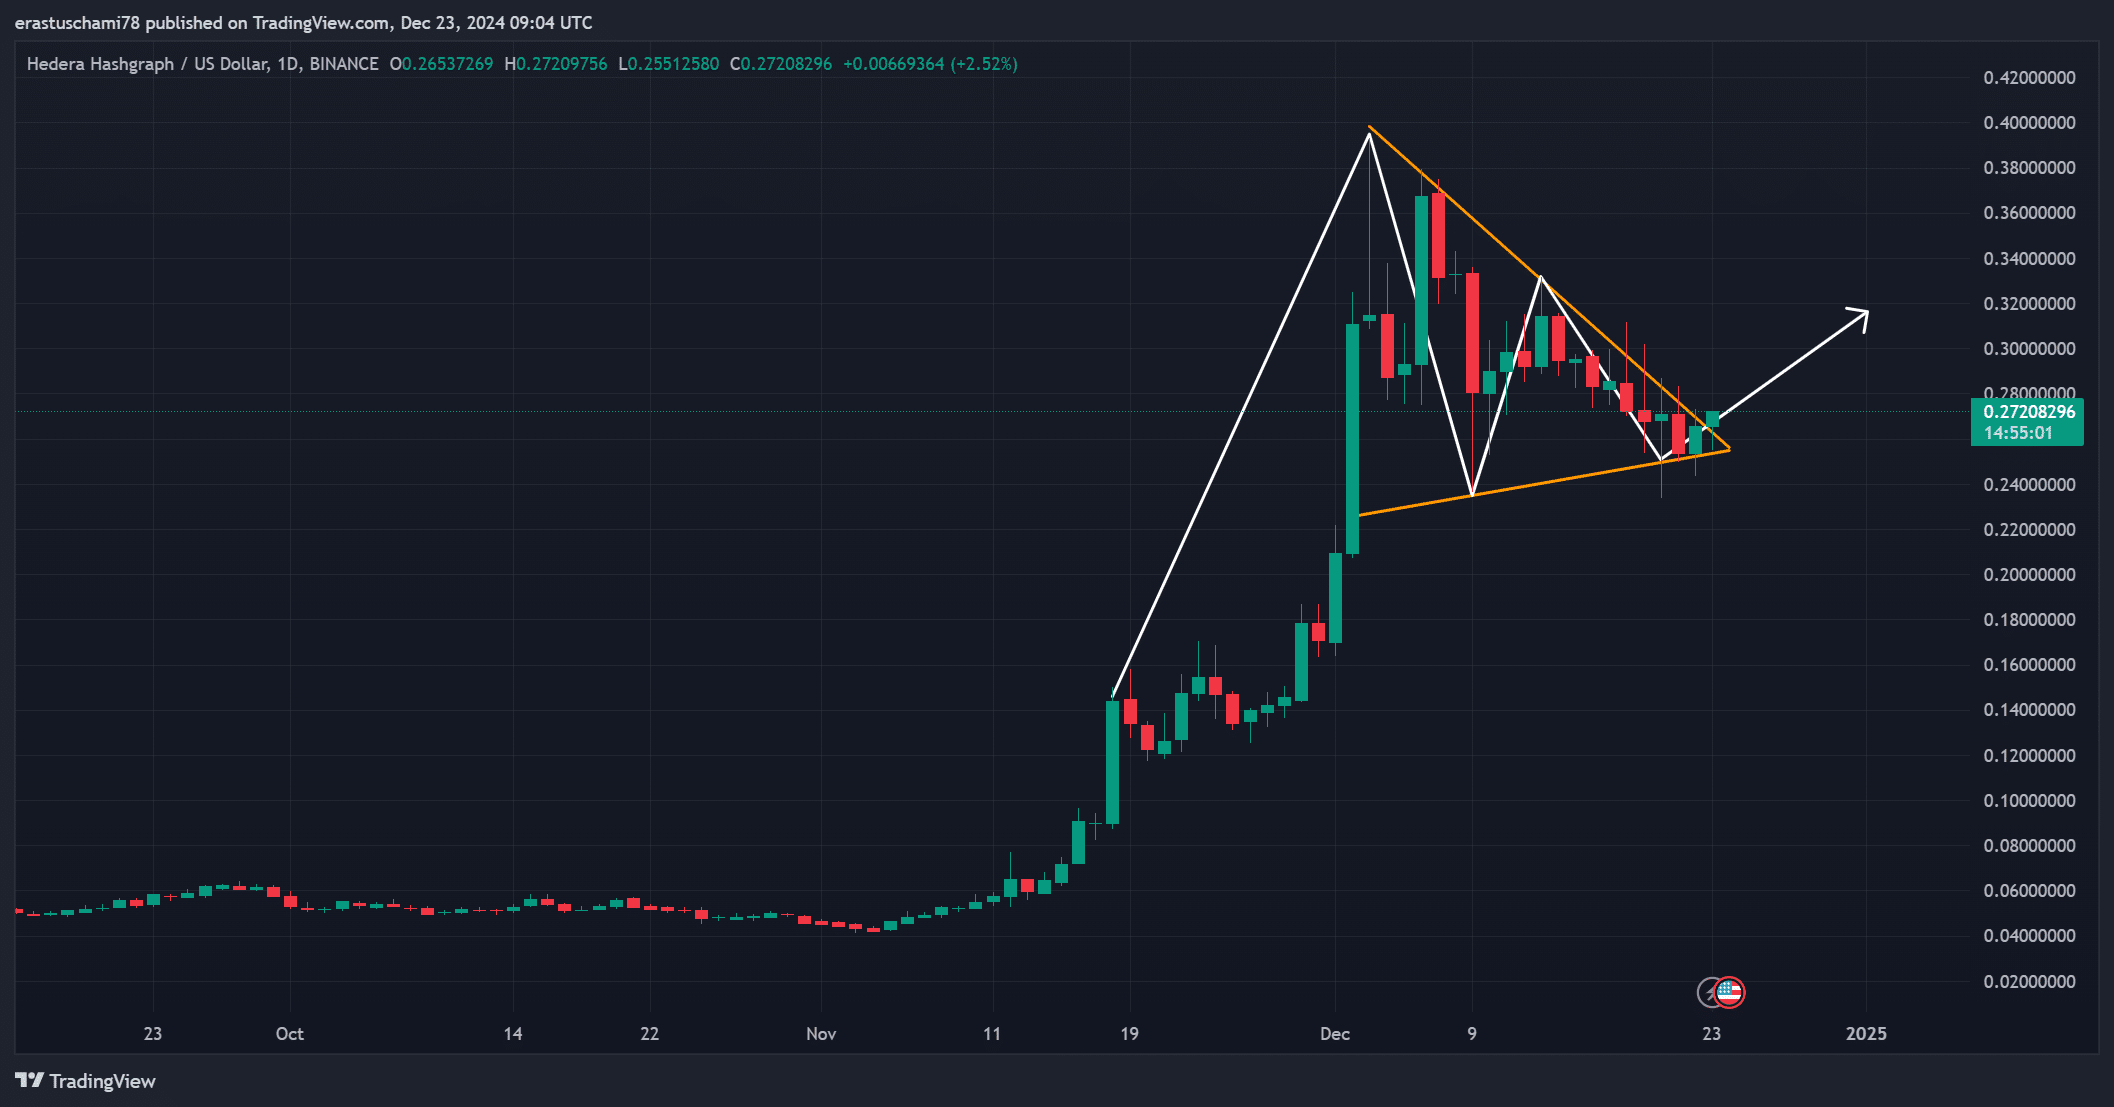
HBAR’s daily chart shows a bullish pennant pattern, a consolidation phase after the recent rally. The waning price action reflects the increasing indecision in the market.
However, this often precedes a significant price movement. Breaking the $0.31 resistance level could unlock further upside potential, with $0.35 and $0.40 as immediate targets.
Furthermore, the well-defined pattern adds credibility to a potential bullish breakout scenario.


Source: TradingView
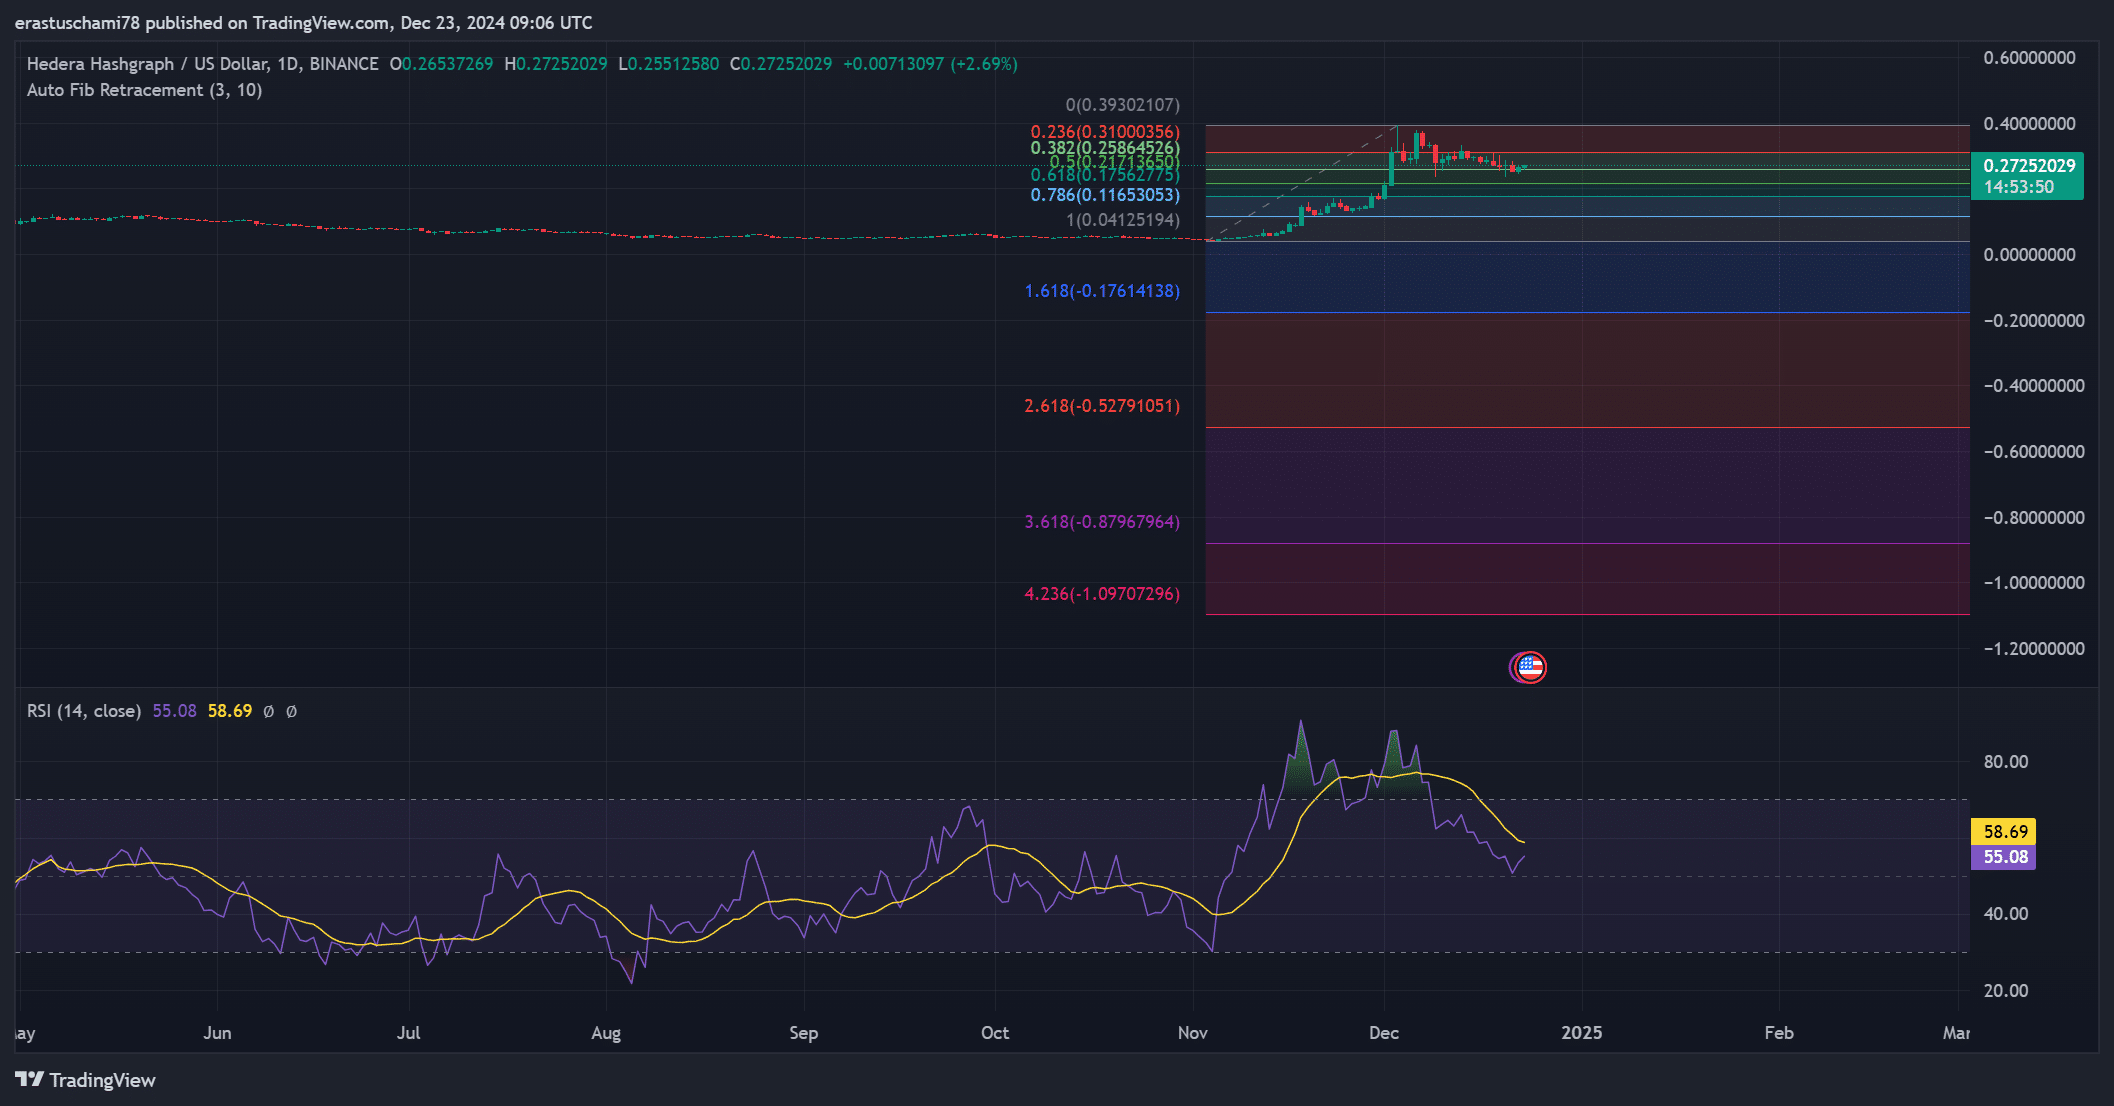
Fibonacci retracement levels highlight the key price zones for HBAR. The $0.236 retracement near $0.31 serves as critical resistance, while the $0.382 level near $0.28 provides short-term support. Meanwhile, the
The Relative Strength Index (RSI) stands at 58.69, indicating moderate bullish momentum. Therefore, there is plenty of room for growth without the risk of being overbought, reinforcing the bullish situation.


Market sentiment analysis: liquidations and open interest
HBAR liquidation data reveals $104.57K in shorts compared to $95.16K in longs, showing slightly higher bearish sentiment. However, open interest rose 5.66% to $221.01 million, reflecting growing trader confidence and increased market activity.
Consequently, these numbers suggest that a decisive move is imminent, whether upward or downward.


Source: Coinglass
Development activity on the Hedera network remains steady at 107, with GitHub contributions increasing this month.
Furthermore, the focus on improving the ecosystem reflects the long-term stability of projects, a factor that often inspires investor confidence. Therefore, HBAR’s fundamentals remain in line with the bullish technical indicators.


Source: Santiment
Is your portfolio green? Check out the HBAR Earnings Calculator
HBAR is poised for a breakout, with its bullish pennant pattern and strong technical indicators supporting a rally. A move above $0.31 is likely to confirm the bullish sentiment and open the door to higher price levels.
Therefore, it appears that HBAR’s next upward trajectory is not just a possibility, but a strong probability.


