Cardano price started a consolidation phase below the $0.6650 zone. ADA is holding onto gains and could target another surge above $0.6500.
- ADA price started a downward correction after a strong rally towards USD 0.6600.
- The price is trading above $0.580 and the 100-hourly moving average.
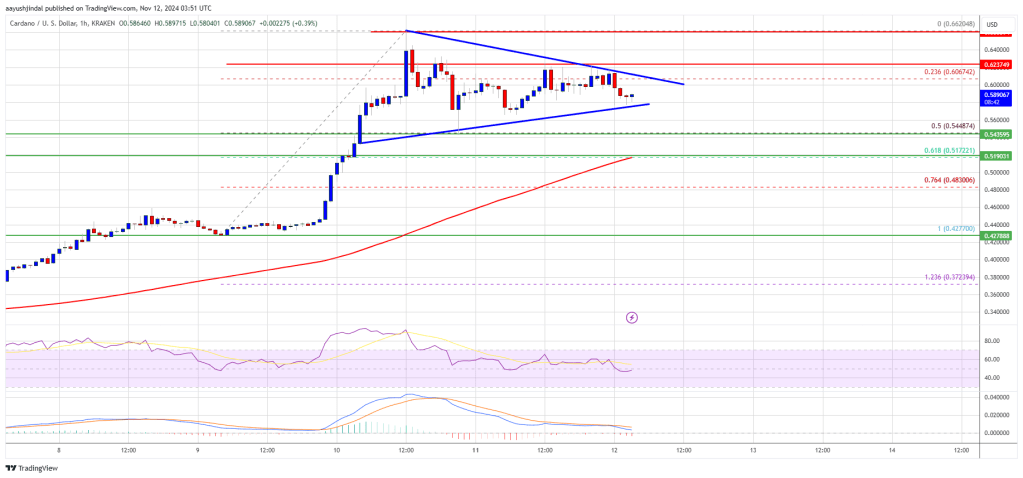
- A major contracting triangle is forming with support at $0.5780 on the hourly chart of the ADA/USD pair (Kraken data source).
- The pair could start rising again if it breaks the $0.6060 resistance zone.
Cardano Price consolidates gains
In recent days, Cardano saw a big rise above the $0.40 resistance. ADA surpassed Bitcoin and Ethereum. There was a move above the USD 0.450 and USD 0.50 resistance levels.
It even reached the USD 0.600 level. A high was reached at $0.6620 and the price is now consolidating gains. There was a small decline below the USD 0.6120 level. The price fell below the 23.6% Fib retracement level of the upward move from the $0.4277 swing low to the $0.6620 high.
However, the bulls are active above $0.5500 and the 50% Fib retracement level of the upward move from the $0.4277 swing low to the $0.6620 high. Cardano price is now trading above $0.580 and the 100-hourly moving average.
A major contracting triangle is also forming with support at $0.5780 on the hourly chart of the ADA/USD pair. On the upside, the price could encounter resistance near the $0.6060 zone. The first resistance is near $0.6230. The next major resistance could be at $0.6450.

If there is a close above the resistance at $0.6450, the price could start a strong rally. In the mentioned case, the price could rise towards the $0.6800 region. Further gains could require a move towards $0.700.
More losses in ADA?
If Cardano price fails to rise above the USD 0.6060 resistance level, it could trigger a fresh decline. The immediate downside support is near the $0.5780 level.
The next major support is near the $0.550 level. A downside break below the USD 0.550 level could open the doors for a test of USD 0.5180. The next major support is near the $0.500 level where the bulls could emerge.
Technical indicators
Hourly MACD – The MACD for ADA/USD is losing momentum in the bearish zone.
Hourly RSI (Relative Strength Index) – The RSI for ADA/USD is now below the 50 level.
Major support levels – USD 0.5780 and USD 0.5500.
Major resistance levels – $0.6060 and $0.6450.

