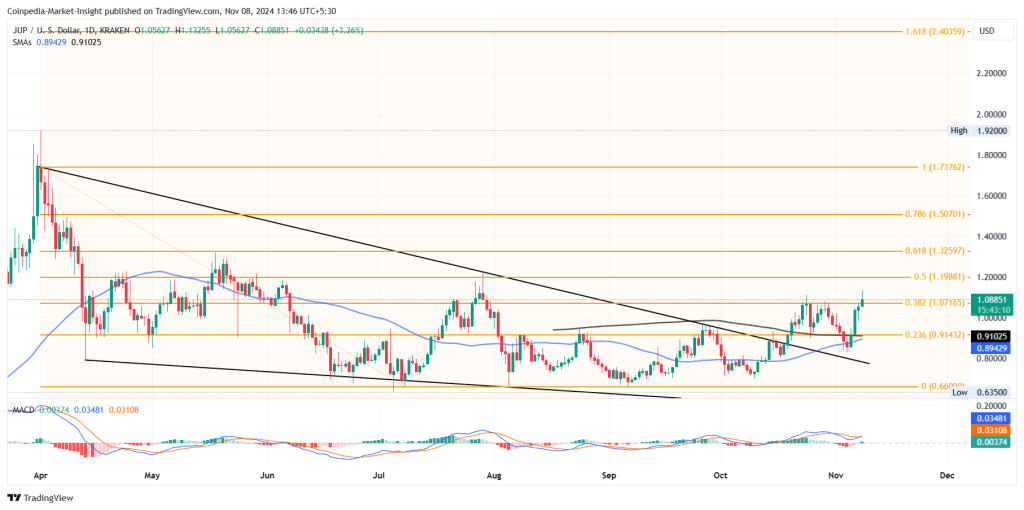
One of the best performing Solana-based DeFi protocols with rising TVL, Jupiter (JUP) witnessed a ~35% price rally. Now that the altcoin has regained the psychological barrier of $1, the uptrend is seeing a bullish extension.
Will this trend reversal rally in Jupiter reach $2 as SMAs prime for a gold crossover? Read more about Coinpedia’s JUP price analysis.
Jupiter (JUP) price targets $1.50
As a falling wedge breakout gains momentum, Jupiter shows a rapid V-shaped reversal. With four consecutive bullish candles, the Jupiter token price has risen almost 32% from a seven-day low of $0.83 to the current market price of $1.33.

The recovery run regains the psychological barrier of $1.00 and marks a change of characters with the breakout of the Fibonacci level of 38.20%. While the bull run is reclaiming the psychological barrier at $1.00, the reversal after the retest of the descending wedge breakout rally marks a trend reversal.
Moreover, the neckline break at the 38.20% level increases the probability of a bull run to $1.50 or the 78.60% Fibonacci level.
Technical indicators:
MACD: The fast V-shaped reversal leads to a positive crossover between the MACD and signal lines.
SMA: The growing bullish influence indicates a golden crossover between the 50-day and 200-day simple moving average line.
Jupiter Price Targets
Based on the Fibonacci levels, the uptrend could target the $1.762 level or the 100% level, with price targets extending to the psychological $2.00 level. On the downside, a retest after the $1.0716 breakout is possible, with the next support at $0.9143.
With a trend reversal run, will Jupiter reach the $2 mark? Discover Coinpedia’s Jupiter price prediction NOW and subscribe to the latest crypto updates.
Frequently asked questions
Jupiter’s recent rise has been attributed to a falling wedge breakout, pushing it back to the $1 mark, and positive technical indicators such as the MACD crossover.
Analysts are targeting $1.50 and possibly $2.00 based on Fibonacci levels, with crucial support at $1.0716.
A gold crossover between the 50-day and 200-day SMAs indicates a bullish trend, pointing to possible further price increases.

