

This article is available in Spanish.
After the recent market pump, the leading cryptocurrencies have achieved remarkable performance. Bitcoin is trading above $64,000, while Ethereum (ETH) has risen 9% over the past week to consolidate above a key support level.
Despite the bullish sentiment, some crypto investors remain cautious about ETH’s performance as the second-largest cryptocurrency faces the next crucial resistance level.
Related reading
Ethereum consolidates above USD 2,600
Ethereum recorded a 13% price increase over the past seven days after the US Federal Reserve (Fed) announced its decision to cut interest rates by 50 basis points (bps). The bullish momentum pushed the price of ETH to levels not seen in a month, creating positive sentiment among many investors.
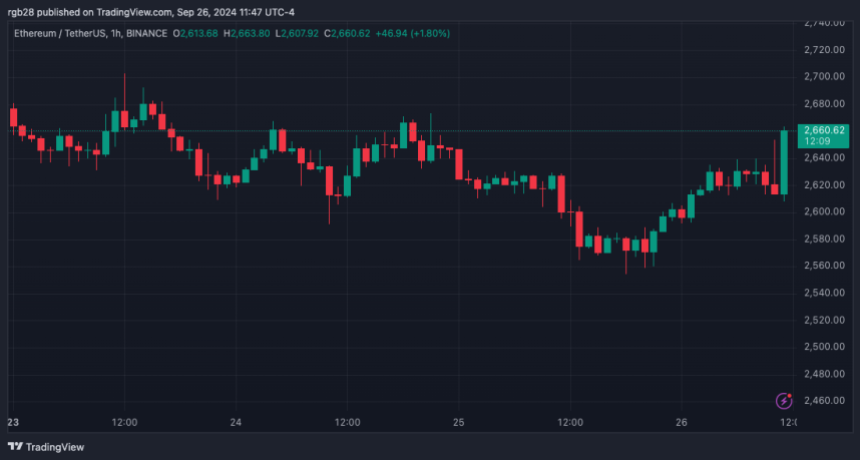
Over the weekend, the “King of Altcoins” rose from the $2,300 support zone to the $2,500 mark before reclaiming the $2,600 resistance level at the start of the week. Since then, the cryptocurrency has fluctuated between the $2,600-$2,684 price range, temporarily falling below the key support level on Wednesday afternoon.
Nevertheless, Ethereum has faced resistance today after recovering from the recent drop to $2,500. Market analyst Crypto Yapper noted that ETH “encountered critical resistance on the Daily chart” as it had not successfully broken above $2,650 since Tuesday.
This performance worried some investors, who believed that failure to exceed this level could hinder the cryptocurrency’s price and send the price towards the previous support zones.
However, Ethereum’s price rose 1% in the past hour, trading above $2,650. At the time of writing, ETH is exchanging hands at $2,660, representing a price increase of 2.1% and 9.3% in the daily and weekly time frames.
ETH will reach new highs in October?
Crypto trader Daan marked that the price of Ethereum has made a higher low (HL), but has not yet been able to reach a higher high (HH). The trader noted that an HH would occur above $2,820, which was lost over a month ago, and that this would mark a trend reversal for the cryptocurrency.
This level matches the horizontal level that initiated the February-March run to $4,090 after the breakout. Additionally, it coincides with the Daily 200 Exponential Moving Average (EMA) around that area, making it “an important level to watch.”
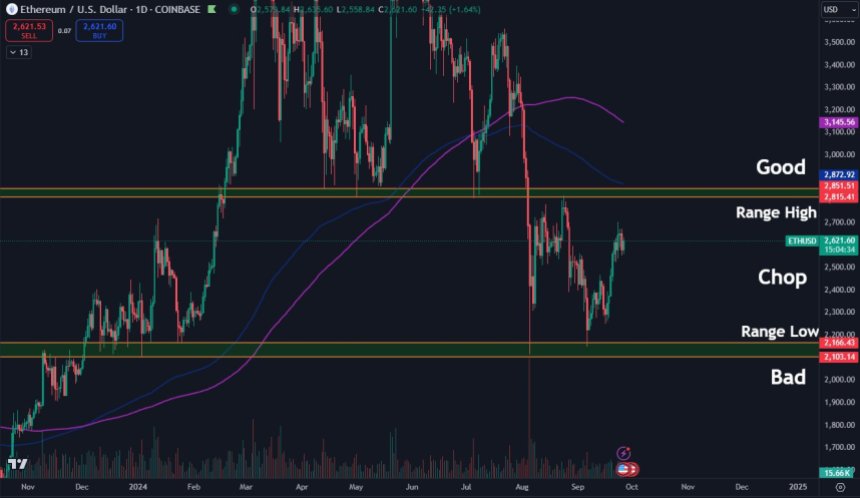
A breakout above this level could push ETH’s price further towards the $3,000 resistance level. Julien Bittel, head of macro research at Global Macro Investor (GMI), noted that Ethereum’s graph “looks a lot like a 2023 redux.”
Related reading
According to the chart, the cryptocurrency’s current market structure looks very similar to its 2023 moves. A repeat of ETH’s previous bullish trajectory suggests that ETH’s price is poised to break out and set a new all-time high in mid-to-late October (ATH) will reach.
Furthermore, the chart shows that if Ethereum’s price follows the same bullish trend, it has the potential to reach somewhere between $10,000 and $20,000 targets in the first quarter of 2025, which would represent a 669% increase from the current price and a jump of 300% from the current price. ATH.
Featured image from Unsplash.com, chart from TradingView.com